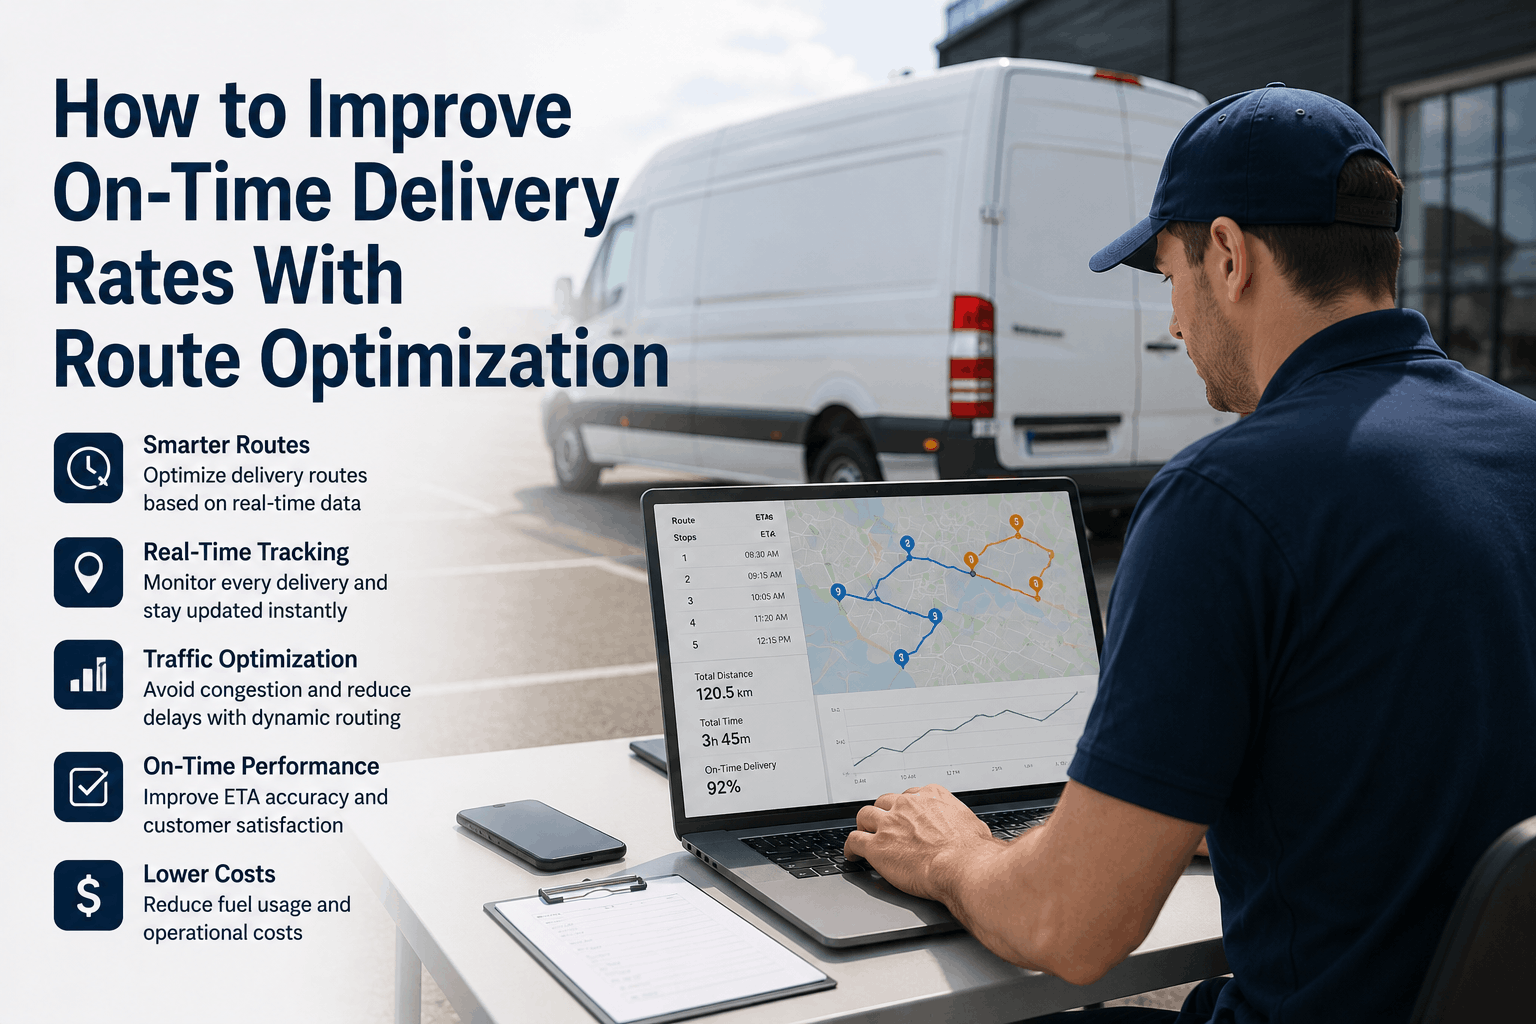
On-time delivery is no longer a logistics metric — it's a brand metric. In the U.S. and Europe, 85% of online shoppers say they won't reorder from a retailer after two late deliveries, and same-day or next-day expectations set by Amazon have made the delivery window a customer promise that operations teams must keep at scale. Yet most delivery fleets miss 18–26% of committed delivery windows — not because of capacity failures, but because of route planning failures: static schedules that ignore live traffic, stop sequences that create impossible time commitments, and dispatch decisions made without real-time visibility into vehicle position. Route optimization software attacks on-time delivery performance across six measurable dimensions simultaneously — reducing late deliveries 28–35%, improving customer satisfaction scores 18–24%, and eliminating the operational firefighting that consumes dispatch bandwidth on fleets still running manual planning. Fleet Rabbit's route optimization platform combines AI-driven route planning, real-time traffic response, delivery window matching, and live dispatch visibility — purpose-built for the on-time performance demands of U.S. and European e-commerce last-mile operations. Book a demo to see Fleet Rabbit's route optimization applied to your delivery operation.
Quick Answer
Route optimization improves on-time delivery rates through six mechanisms: time-window-matched route sequencing that builds realistic schedules from actual traffic and dwell data, live traffic rerouting that recovers time lost to congestion before windows close, proactive customer ETA notifications that reduce failed attempts, stop-capacity improvement that prevents schedule overload, dynamic stop reassignment when vehicles fall behind, and delivery analytics that fix the systematic routes and drivers generating late deliveries. Fleets using Fleet Rabbit's optimization improve on-time delivery rate 18–24% and reduce customer delivery complaints 30–38% within 90 days of deployment.
Why On-Time Delivery Fails — and What Route Optimization Fixes
Late deliveries in U.S. and European fleets share a common root cause: routes are planned on optimistic assumptions — ideal traffic, average dwell times, clean address data — that reality dismantles by 10 AM. Understanding the specific failure modes that optimization corrects makes the ROI case concrete.
Static Schedules in Dynamic Cities
Manual route plans are built once at morning dispatch and don't update. A 20-minute traffic incident on I-95 or the M25 makes every downstream delivery on that route late — and dispatchers find out when drivers call in, not when there's still time to reroute. Route optimization responds to live conditions in real time.
Unrealistic Stop Dwell Assumptions
Manual dispatch assumes 2–3 minutes per stop regardless of delivery type. Apartment building deliveries average 5.8 minutes. Business deliveries requiring signature average 7.2 minutes. Routes planned on flat dwell assumptions are guaranteed to run late — the error compounds stop by stop across a 30-stop route.
Customer Promise vs. Route Reality
Delivery windows promised at checkout — "2 PM–6 PM Tuesday" — are assigned without checking whether the planned route can actually meet them. When 6 of 35 stops have committed 2-hour windows, route optimization sequences and validates that each window is achievable before the vehicle leaves the depot. Manual dispatch discovers the conflict at 5:45 PM.
Way #1: Time-Window-Matched Route Sequencing — Build Routes That Can Be Kept
The most direct improvement to on-time delivery rate comes before a vehicle leaves the depot: building sequences that are actually achievable given real traffic patterns, realistic dwell times by stop type, and committed customer windows — not sequences that look complete on paper but fail in execution.
1
Delivery Window Validation at Planning Stage
Fleet Rabbit validates every committed delivery window against planned route sequencing and live traffic conditions before dispatch. If stop 14 has a 10 AM–12 PM window but the route as planned would arrive at 12:40 PM, the system flags the conflict and offers a resequencing option — not a mid-route crisis. Dispatchers see ETA confidence scores for every window before vehicles leave.
Example: 38-stop route in the Chicago suburbs. Manual planning assigned a 9–11 AM business delivery as stop 22. Fleet Rabbit resequenced it to stop 6, moved three residential stops to fill the morning gap, and validated all four committed time windows without adding route distance. Zero window violations on that route versus two per day average pre-optimization.
2
Dwell Time Calibration by Stop and Delivery Type
Fleet Rabbit builds per-address and per-stop-type dwell time profiles from historical delivery data — using actual measured dwell times rather than dispatcher assumptions. Routes are sequenced against realistic time budgets: 2.1 minutes for a doorstep residential drop, 5.8 minutes for an apartment with access code, 7.4 minutes for a business requiring signature confirmation. Calibrated dwell times eliminate the compounding schedule drift that makes every stop after stop 10 progressively later.
Residential doorstep: 2.1 min avgApartment building: 5.8 min avgBusiness signature: 7.4 min avg
3
Schedule Buffer Allocation for High-Priority Windows
Not all delivery windows carry equal cost when missed. A missed pharmaceutical delivery or a missed business restocking window carries higher operational and relationship cost than a residential parcel. Fleet Rabbit allows dispatchers to flag high-priority windows that receive schedule buffer — additional time cushion that absorbs minor delays without cascading into a window miss.
Time-window sequencing alone improves on-time window compliance 14–18% in the first month — the single highest-impact optimization mechanism for customer-facing delivery performance.
Route Optimization + Live Dispatch
Improve On-Time Delivery Rate 18–24% — From the First Optimized Route
Fleet Rabbit's optimization engine matches routes to committed delivery windows before dispatch — using real traffic, calibrated dwell times, and live ETA validation so every vehicle leaves with a schedule it can actually keep.
18–24%
On-Time Rate Improvement
28–35%
Late Delivery Reduction
Ways #2–5: Four More On-Time Performance Drivers
Window-matched sequencing creates the foundation. Four additional optimization mechanisms handle the dynamic reality of delivery day — responding to traffic, managing customer expectations, preventing schedule overload, and recovering from individual vehicle delays before they cascade.
Way #2: Real-Time Traffic Rerouting — Recover Time Before Windows Close
The problem: A single traffic incident — accident on the highway, road closure in central London, bridge closure in Amsterdam — can add 20–40 minutes to a route segment, making every downstream delivery window unachievable if dispatchers don't reroute proactively.
How optimization fixes it: Fleet Rabbit monitors live traffic across all active routes simultaneously — triggering reroute suggestions the moment a delay projects a window miss, not after the driver reports being stuck. Alternate routes are evaluated against remaining window commitments and the cost of deviation before being suggested to the driver.
Measured outcome: Live traffic rerouting prevents window misses on 60–72% of traffic-delay events that would otherwise produce late deliveries under static routing. Equivalent to recovering 8–12 minutes of schedule time per affected vehicle per day on urban U.S. and European routes.
Way #3: Proactive ETA Notifications — Reduce Failed Attempts That Look Like Late Deliveries
The problem: 28–34% of "late delivery" complaints in U.S. and EU consumer surveys are actually failed delivery attempts — the driver arrived on time, but the customer wasn't home. From the customer's perspective, the delivery was missed. From a satisfaction score perspective, it registers identically to a genuine late delivery.
How optimization fixes it: Fleet Rabbit generates live ETA notifications from actual vehicle position — sending a "your driver is 3 stops away, arriving in approximately 18 minutes" message that gives customers a real window to be present, not a static morning estimate. Accurate ETAs from live tracking reduce not-home failures 28–35%.
Measured outcome: Every prevented not-home failure is both a customer satisfaction win and a cost saving — eliminating a $6.40–$9.80 redelivery attempt while converting a potential complaint into a successful delivery experience.
Way #4: Stop-Count Optimization — Prevent Schedule Overload Before Dispatch
The problem: On peak days — Monday after a weekend sale, post-holiday return volumes, promotional flash events — dispatchers assign more stops per vehicle than the shift can absorb at realistic dwell times. The result is predictable: the last 8–10 stops on every overloaded route miss their windows, drivers run overtime, and customers receive late-delivery apology emails for a failure that was locked in at 7 AM dispatch.
How optimization fixes it: Fleet Rabbit calculates maximum achievable stop count per vehicle per shift based on route distance, traffic, stop type mix, and committed window constraints — flagging overloaded routes at planning stage and suggesting reallocation before vehicles leave. Stop overload is a planning failure; Fleet Rabbit makes it visible and fixable before it becomes a customer failure.
Measured outcome: Eliminating stop overload reduces end-of-route late deliveries 40–55% on peak-volume days — the days that generate the most customer complaints and satisfaction score damage.
Way #5: Dynamic Stop Reassignment — Recover Individual Vehicle Delays in Real Time
The problem: A vehicle that runs 25 minutes late by stop 10 will miss every remaining committed window on that route under static dispatch. Dispatchers managing 40+ vehicles can't monitor individual ETA drift until drivers or customers report failures.
How optimization fixes it: Fleet Rabbit's live dispatch dashboard shows ETA accuracy for every active vehicle — flagging vehicles where projected arrival times are drifting outside committed windows. Dispatchers can reassign the at-risk stops to a nearby vehicle completing ahead of schedule, preserving the customer window without adding a vehicle to the day's operation.
Measured outcome: Dynamic reassignment prevents window misses on 45–60% of individual vehicle delay events. On a 50-vehicle fleet, this represents 8–14 preserved delivery windows per day that static dispatch would have failed.
Way #6: Delivery Analytics — Fix the Routes and Drivers Generating Late Deliveries
The first five mechanisms improve on-time performance operationally. The sixth mechanism improves it structurally — identifying the specific routes, time windows, stop types, and driver behaviors where late deliveries systematically concentrate, and enabling targeted corrections that compound over time.
Late Delivery Pattern Identification by Route and Time Window
Fleet Rabbit records on-time status, actual vs. planned arrival time, and delay reason for every delivery — surfacing the routes that chronically run late, the time windows that are structurally unachievable given traffic patterns, and the stop sequences that create unavoidable schedule drift. Route 7 running late every Tuesday afternoon isn't random variation — it's a school dismissal traffic pattern that analytics pinpoints precisely, enabling a permanent schedule adjustment rather than repeated daily firefighting.
Driver-Level On-Time Performance and Dwell Time Analysis
On-time delivery rate varies 2–3x between drivers on identical routes — driven by differences in stop dwell time, navigation behavior, and schedule adherence. Fleet Rabbit's driver analytics identify which drivers are running 40% above fleet-average dwell time at apartment stops, or which drivers consistently fall 15–20 minutes behind schedule by stop 8 regardless of route. Targeted coaching from specific data — not general instructions — produces measurable on-time improvement within 2–3 weeks of analytics-driven intervention.
The Combined On-Time Delivery Improvement: All 6 Ways Together
18–24%
On-Time Rate Improvement
28–35%
Late Delivery Reduction
30–38%
Customer Complaint Reduction
28–35%
Fewer Failed Delivery Attempts
40–55%
Peak-Day Window Miss Reduction
30–60 days
Time to Measurable Improvement
Frequently Asked Questions
QHow quickly does route optimization show measurable on-time delivery improvement?
Time-window-matched sequencing and live traffic rerouting produce measurable on-time improvement from day one — the first optimized routes are sequenced against realistic ETAs rather than optimistic assumptions, immediately reducing window misses on routes with committed delivery times. Accurate ETA notifications reduce not-home failures within the first week. Driver behavior improvement from analytics-driven coaching typically shows measurable on-time impact within 30 days. The complete 18–24% on-time improvement compounds over 60–90 days as delivery analytics accumulate enough pattern data for structural route corrections. Most operations see customer satisfaction score improvement within the first 30 days as late delivery complaint volumes decline.
QDoes route optimization handle the delivery window commitments made at checkout by e-commerce platforms?
Fleet Rabbit ingests delivery window commitments from your order management system via API — treating each committed window as a hard constraint in route sequencing, not a preference. Routes are built to honor window commitments first, then optimize for distance and fuel efficiency within those constraints. Where window commitments conflict with vehicle capacity or route geography, Fleet Rabbit flags the conflict at planning stage — before dispatch, while there's still time to reassign stops or adjust windows — rather than discovering the failure mid-route. This pre-dispatch validation is the difference between a proactive scheduling adjustment and a reactive customer apology.
QHow does Fleet Rabbit improve on-time delivery during peak volume events like Black Friday or holiday periods?
Fleet Rabbit's optimization engine handles 2–5x normal delivery volume without degradation in route quality or planning speed. For peak events, Fleet Rabbit's capacity planning tools show how many vehicles and shifts are required to meet all committed delivery windows given projected volume — identifying the breakeven point where additional vehicles are more cost-effective than extending shift hours. Pre-event route templates can be prepared for high-volume zones, reducing morning dispatch time on days when operations need to move fast. Post-event analytics identify which zones overdelivered or underdelivered against projections, improving future peak planning accuracy and reducing the window miss rate that peak days typically generate.
Improve Your On-Time Delivery Rate 18–24% — See Fleet Rabbit's Route Optimization in Action
Fleet Rabbit's route optimization platform delivers all 6 on-time delivery improvements through one integrated system — window-matched sequencing, live traffic rerouting, customer ETA notifications, stop capacity planning, dynamic reassignment, and delivery analytics working simultaneously across your entire fleet. Most U.S. and European operations see measurable on-time rate improvement within the first week of deployment.
18–24% On-Time Improvement
28–35% Fewer Late Deliveries
Live Traffic Rerouting
Customer ETA Notifications
30–60 Day Results
May 25, 2026
By John Mark
All Posts