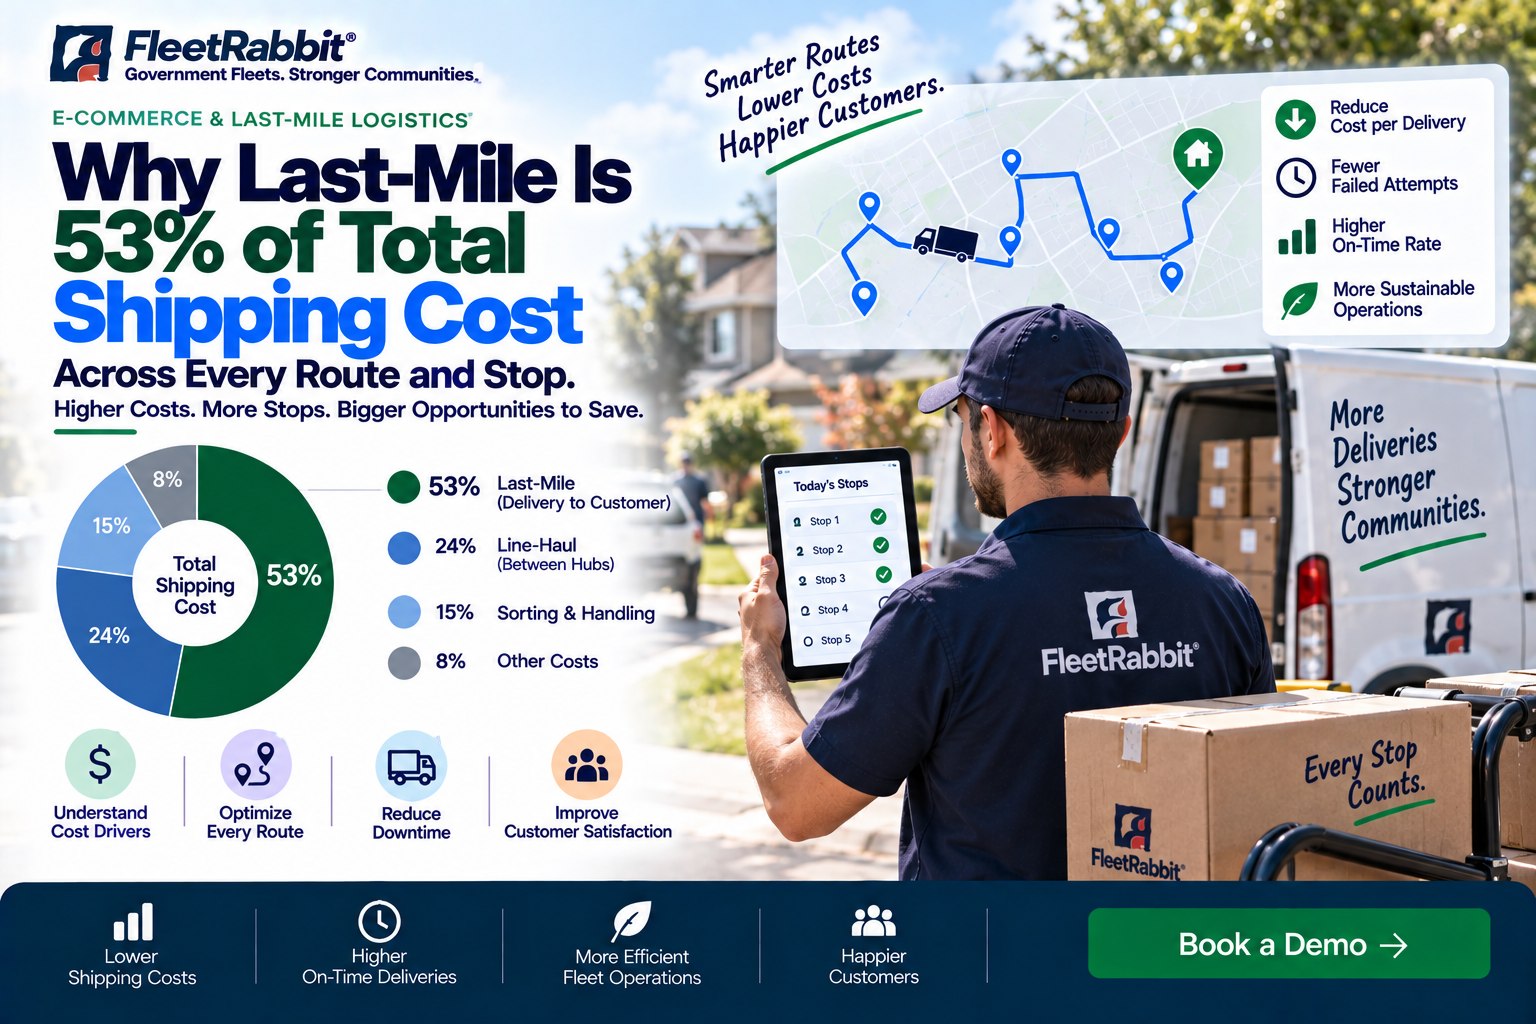
High-volume e-commerce carriers, regional parcel couriers, and contract logistics providers face a punishing economic reality: the final mile accounts for an average of 53% of total logistics expense. Unlike long-haul freight and line-haul line transportation, where fuel and vehicle maintenance spread across hundreds of highway miles, the last mile absorbs severe urban inefficiencies: high stop frequency, idle-heavy street navigation, building elevator dwell times, failed customer drop-offs, and runaway driver overtime payroll. When operations manage route pacing, vehicle preventive maintenance, and driver schedules on static spreadsheets or generic GPS pings, cost per delivery balloons to unviable levels. FleetRabbit delivers purpose-built delivery optimization and fleet reliability software designed specifically to compress the 53% last-mile cost sink. By unifying constraint-based dynamic route clustering, real-time vehicle predictive maintenance telematics, automated driver pre-trip eDVIR walkarounds, and automated delivery window pacing into an integrated command platform, FleetRabbit reduces last-mile unit expenses by 18% to 24%. Eliminate wasted stem miles, protect vehicles from costly curbside breakdowns, and execute delivery manifests completely offline in subterranean high-rise garages and concrete loading bays with zero cellular connectivity. Book a demo to see how FleetRabbit compresses your last-mile operating overhead.
SECTION: 53% MACRO COST WATERFALL COMMAND HEROWhy Last-Mile Is 53% of Total Shipping Cost Across Every Route and Stop
Squeeze the most expensive leg of fulfillment. Squeeze stem mileage, eliminate secondary re-deliveries, predict vehicle wear before roadside failure, and automate driver shift workloads to recover double-digit parcel margins.
The Four Mathematical Drains Driving 53% Shipping Overhead
Last-mile logistics is structurally vulnerable to margin loss; FleetRabbit targets each primary operational leak simultaneously.
Driver Stop Density & Dwell Deficits
Elevator waiting, high-rise lobby access barriers, and searching for parking slots consume paid driver minutes where no wheels are turning, severely eroding stops-per-hour output.
Failed First-Attempt Deliveries
Missed signatures, restricted security gates, and unverified address pins require parcel re-sorting, warehouse double-handling, and redundant fuel burn on secondary delivery attempts.
Severe Vehicle Stop-and-Go Degradation
Vans cycling 150 stops a day incur extreme thermal wear on foundation brake pads, starter motors, and steer tires compared to over-the-road assets, multiplying unscheduled breakdown risks.
Curbside Idling & Deadhead Fuel Burn
Unoptimized street routing forces drivers to crisscross dense corridors, navigate avoidable left turns against oncoming traffic, and idle engines during prolonged drop intervals.
The Compounding Impact of Unoptimized Route Delivery
Operating delivery fleets without unified route-and-maintenance telematics turns every operational delay into a bottom-line deficit.
Overtime Labor Penalties on Fragmented Shifts
When unexpected urban congestion or long high-rise delivery queues push an 8-hour shift into 10 hours, late-afternoon overtime wages destroy gross profit margins across the entire vehicle's daily freight load.
Midday Breakdown Stranding & Rescue Routing
A failed alternator or seized brake caliper on a residential route requires emergency towing ($400+) and forces dispatch to pull a secondary rescue van off another route, doubling operational overhead for the remaining drops.
Customer SLA Churn & Merchant Penalties
E-commerce merchants enforce strict on-time delivery percentages and delivery window compliance. Slipping below agreed SLA thresholds triggers immediate financial chargebacks and contract cancellations.
Subterranean Concourse & Parking Vault Dead Zones
Drivers executing deliveries inside multi-level underground parking decks, high-rise basement docks, and concrete freight elevators lose cellular reception. Cloud-only apps crash, dropping vital proof-of-delivery timestamps.
Engineering 18%–24% Reductions in Last-Mile Expense
FleetRabbit connects constraint-based delivery clustering, vehicle health telematics, dynamic shift balancing, and mobile proof-of-delivery into one console. Request a 1-on-1 walkthrough.
Micro-Zone Stop Clustering
Compress the geographic footprint of delivery manifests: multi-variable spatial solvers pack delivery density into micro-zones, slashing inter-stop stem miles and maximizing drops per hour.
Location-Specific Dwell Profiling
Account for apartment stairs, commercial loading dock clearance times, and elevator waits automatically, producing realistic route plans that protect drivers from afternoon shift overruns.
Predictive Fleet Maintenance Telematics
Monitor battery cranking voltage, alternator diode ripple, and foundation brake friction degradation in real time; intercept mechanical component failures during evening depot hours.
Underground Dock Offline Mobile Sync
Drivers execute stop sequences, scan barcodes, take photo proof-of-delivery, and record signatures inside concrete freight concourses with zero cell signal; data auto-syncs upon departure.
Dynamic Recipient SMS Geofences
Automated SMS notifications trigger when the delivery van enters a 1-mile perimeter, ensuring signature-required recipients are present and driving first-pass completion to 99%+.
Real-Time Cost-Per-Drop Telemetry
Track live cost per delivery down to the specific route, driver, territory, and vehicle type, identifying unprofitable delivery contracts and pinpointing operational margin leaks.
Cost Compression Aligned with Commercial Safety Mandates
FleetRabbit’s efficiency algorithms enforce federal commercial transportation safety directives and labor guidelines across every scheduled route.
Integrates statutory 30-minute rest break schedules, maximum 11-hour driving windows, and 14-hour on-duty shifts directly into delivery route manifests to eliminate driver fatigue violations.
Standardizes driver pre-trip/post-trip eDVIR walkarounds, steering linkage audits, commercial brake pushrod stroke checks, and 14-month systematic maintenance archives.
Calculates real-time parcel payload distribution across steer and drive axles against chassis Gross Axle Weight Ratings (GAWR), preventing suspension sagging and roadside scale citations.
Maintains verified digital shift records, actual driving timestamps, and automated route pacing logs to substantiate payroll compliance and defend against unverified wage claims.
Last-Mile Optimization Platform Benchmark Comparison
A feature-level comparison focused on unit cost reduction, predictive maintenance, and offline execution as of 2026. Request a technical comparison.
| Capability | FleetRabbit | Generic Fleet CAD | Basic GPS Trackers | Static Spreadsheets |
|---|---|---|---|---|
| Pricing (per asset/month) | $5/month | $25–$60/month | $15–$35/month | High overtime costs |
| 53% Last-Mile Cost Compression | 18%–24% verified | 4%–8% marginal | 0% (tracking only) | 0% (cost inflation) |
| Predictive Fleet Maintenance Telematics | Native electrical & brake solver | Requires separate tool | Not supported | None (breakdown driven) |
| Dynamic Midday Stop Re-Balancing | 2-click courier offload | Manual re-dispatch | Not supported | Driver phone calls |
| Concrete Concourse Offline Mobile Sync | Full store-and-forward | Network dependent | Data dropped | Paper only |
| Free Trial Access | 14 days, up to 3 assets | Sales demo only | Demo only | None |
| Contract Commitment | Monthly or annual | Multi-year lock-in | 3-year minimum | None |
5-Step Last-Mile Cost Reduction Implementation Pathway
FleetRabbit deploys cleanly into your sorting hubs, dispatch control desks, and courier smartphones in under two weeks without freight interruption.
Historical Route & Cost Audit Ingestion
Import previous delivery manifests, payroll overtime records, fuel expenses, and historical vehicle maintenance invoices to calculate your baseline Cost Per Delivery.
Micro-Territory & Dwell Parameter Setup
Configure spatial service zones, appointment delivery windows, vehicle cubic payload limits, and location-specific building dwell times across your target delivery markets.
Predictive Maintenance & eDVIR Integration
Connect OBD-II/J1939 dongles and establish automated degradation thresholds for battery cranking voltage, foundation brake wear, and mandatory pre-trip walkarounds.
Couriers Mobile Application Rollout
Equip last-mile delivery drivers with the offline-first mobile app on standard iOS or Android smartphones for turn-by-turn routing, package scanning, and proof-of-delivery.
Live Margin Optimization Go-Live
Activate live dispatch monitoring boards, dynamic midday re-balancing engines, and 1-click unit-cost reduction reporting across central logistics control desks.
2-Week Deployment Plan & Milestones
Modernize your last-mile logistics operations and compress operating expenses with zero disruption to scheduled distribution shifts. Request an onboarding plan.
Week 1: Data Integration & Policy Setup
- Sync WMS/TMS parcel order streams, customer delivery tiers, and driver shift rosters
- Configure vehicle volumetric profiles, payload limits, and micro-territory boundaries
- Set up pre-trip driver eDVIR checklists and predictive maintenance failure thresholds
- Assign user access roles for Operations Directors, Dispatchers, and Delivery Couriers
Week 2: Depot Rollout & Live Verification
- Distribute mobile app to drivers and conduct 15-minute training on dynamic routing
- Validate store-and-forward offline syncing in concrete loading docks and concourses
- Simulate midday order transfers to verify 2-click dynamic stop re-balancing workflows
- Launch live cost-per-delivery tracking dashboard and automated fuel savings reports
Compress Your Fleet's Last-Mile Shipping Costs by Up to 24%
Maximize stop density, eliminate driver overtime, and prevent roadside vehicle downtime. Start today at $5/asset/month with a 14-day free trial.
Real-World Last-Mile Cost Reduction Results
Operational improvements documented by regional parcel delivery carriers and e-commerce 3PL logistics networks. Request the logistics fleet case study.
21.8% Reduction in Last-Mile Operating Costs Across 78 Vans
A regional parcel carrier delivering across dense metro areas suffered from unsustainable cost-per-delivery numbers driven by excessive deadhead miles and evening overtime payroll. FleetRabbit deployed micro-zone clustering and predictive vehicle maintenance, reducing total last-mile expenses by 21.8% and saving $142,000 in labor and fuel in year one.
$1.38 Cost-Per-Drop Savings Across 55 Delivery Vans
A contract e-commerce fulfillment carrier operating 55 cargo vans struggled with failed delivery attempts and unbudgeted vehicle alternator and brake repairs. FleetRabbit introduced recipient SMS notifications and predictive maintenance alerts, reducing average cost per delivery from $6.24 to $4.86 while achieving 99.4% first-pass delivery success.
In the e-commerce fulfillment business, the line-haul and sorting operations run like clockwork, but the last mile will completely drain your profitability if you let it. You are dealing with hundreds of delivery vans fighting city traffic, drivers burning minutes searching for parking in high-rise districts, packages not delivered on attempt one, and delivery vans breaking down mid-route. FleetRabbit completely transformed our unit economics. It packed our route density tighter, warned us about failing starter batteries and brake wear days before they failed on the road, and gave our drivers offline tools that never freeze inside concrete parking decks. It reduced our overall cost per delivery by over twenty percent in ninety days. It is the single most valuable operational software we have deployed.
Frequently Asked Questions
Start Compressing Your Fleet's Last-Mile Shipping Costs in Less Than 2 Weeks
Recover double-digit parcel delivery margins, eliminate driver overtime bloat, and prevent midday roadside breakdowns at $5/asset/month with a 14-day free trial.







