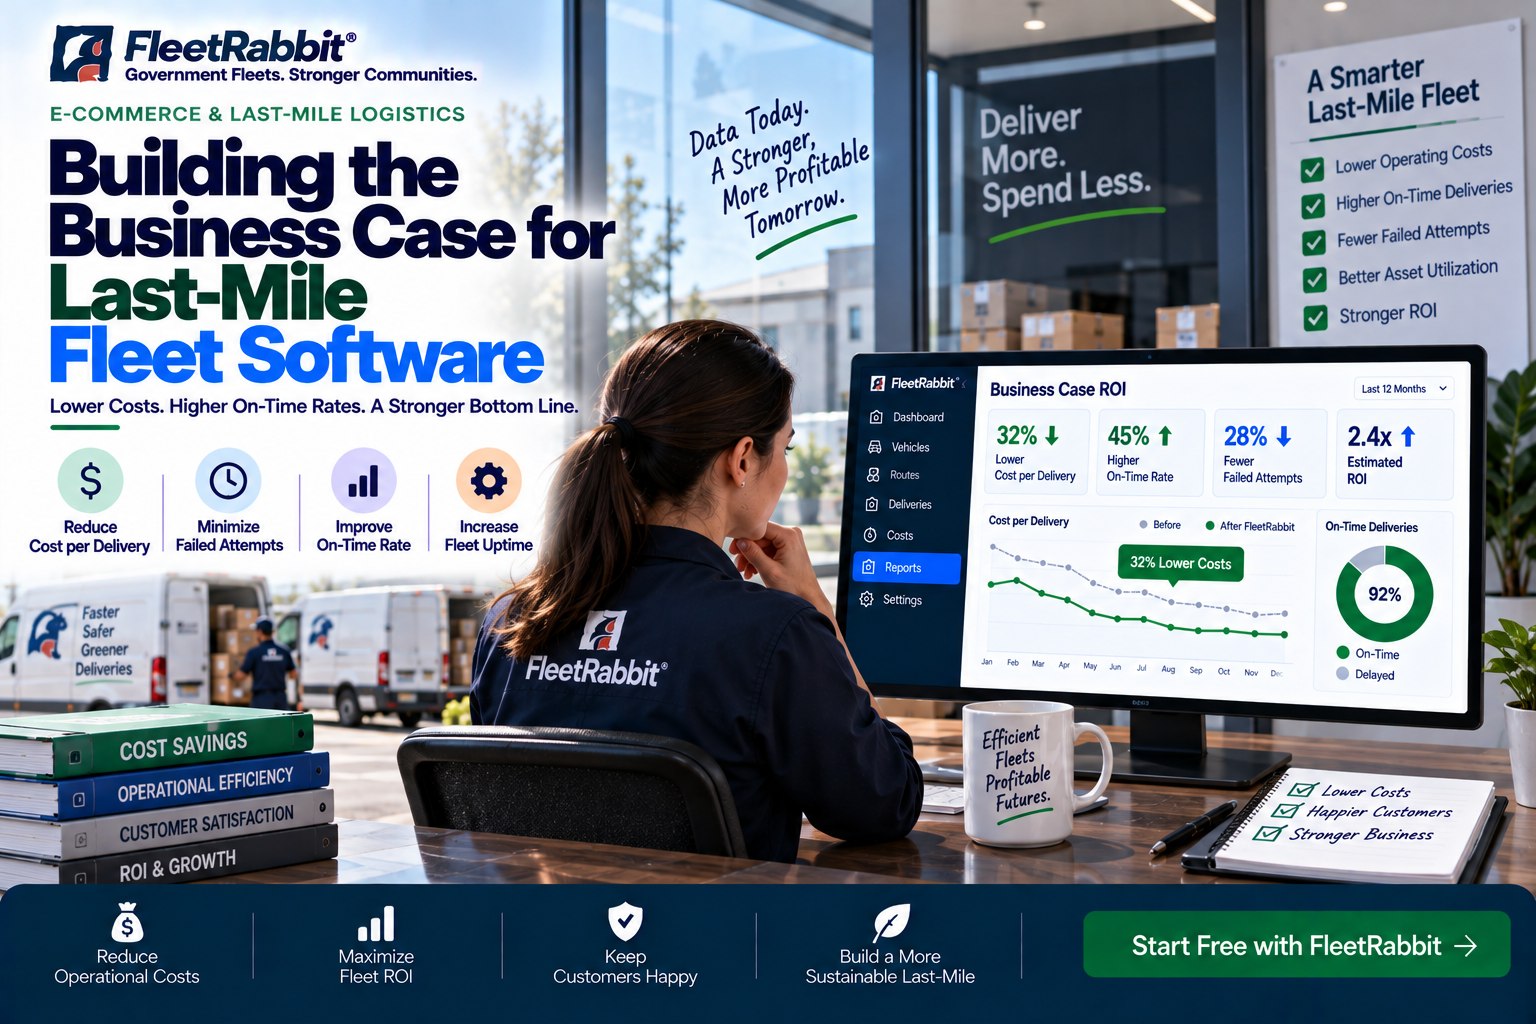
Operations executives, finance directors, and fleet managers in e-commerce parcel delivery face mounting board-level pressure: reducing cost per delivery (CPD) amid stubborn fuel costs, curbing runaway overtime payroll, eliminating roadside towing invoices, and avoiding contractual SLA breach penalties. When last-mile fleets manage dispatches using disparate legacy GPS trackers, fragmented spreadsheets, and uncoordinated maintenance notebooks, operating margins deteriorate rapidly. FleetRabbit delivers dedicated last-mile fleet software engineered to create an airtight, verifiable business case for fleet modernization. By uniting constraint-based route clustering, proactive predictive maintenance telematics, mobile pre-trip eDVIR checkouts, and dynamic midday parcel re-balancing into a unified platform at a transparent $5/asset/month, FleetRabbit generates a demonstrable 4.8x to 7.2x return on investment within 90 days. Eliminate administrative manual planning waste, extend the lifecycle of commercial delivery vans, and maintain continuous mobile operations completely offline inside concrete sorting terminals and underground delivery docks with zero cellular connectivity. Book a demo to calculate your fleet's exact ROI with FleetRabbit.
Building the Business Case for Last-Mile Fleet Software
Quantify the hard-dollar financial return of modern last-mile software. Compress cost per delivery by $0.45–$0.70 per stop, eliminate 40% of unscheduled mechanical downtime, and payback your software investment in under 45 days.
The 4 Value Levers That Win Boardroom Approval
Securing budget approval requires concrete financial returns; FleetRabbit translates operational improvements directly into audit-ready balance sheet savings.
Cost Per Delivery Reduction
By clustering route drops and eliminating deadhead backtracking, fleets increase stops completed per driver hour while shrinking net vehicle operational miles.
Payroll Overtime Elimination
Automated shift balancing accounts for real building dwell times, preventing late-afternoon driver delays that force unbudgeted overtime pay at time-and-a-half.
Emergency Repair Mitigation
Continuous CAN-bus telemetry intercepts dying starter batteries and worn foundation brakes days before they fail on the route, eliminating $450 emergency tow bills.
SLA Penalty Shielding
Dynamic midday parcel offloading allows dispatchers to transfer at-risk stops across nearby ahead-of-schedule couriers with two clicks, neutralizing client penalty chargebacks.
The Compounding Liability of In-House Legacy Processes
Continuing to operate last-mile delivery fleets on manual spreadsheets and disconnected GPS tools creates hidden expense leaks that silently bleed margin.
Dispatcher Wage Drain & Manual Planning Latency
Dispatchers spending 3 to 4 hours every morning manually sorting manifests across clipboards and spreadsheets drain administrative payroll while creating rigid delivery routes that collapse when early morning parcel volumes surge.
Uncontrolled Secondary Attempt Penalties
A package missed on attempt one costs $12 to $16 in redundant sorting, warehouse storage, and duplicate fuel burn. Operating without automated customer arrival notifications drives failed first-pass rates above 8%, destroying route efficiency.
Catastrophic Secondary Powertrain Damage
Relying on drivers to report vehicle defects on paper forms leads to skipped walkarounds. Neglected low coolant or worn brake pads escalate into warped cylinder heads and scored brake drums, inflating annual fleet repair invoices.
Depot Basement & Urban Canyon Dead Zones
Parcel sorting and load verifications frequently occur inside concrete depot barns or underground parking concourses with zero cellular connectivity. Fragile cloud-only software freezes, delaying morning route pull-outs.
Built to Maximize Net Operating Profit per Delivery Stop
FleetRabbit consolidates delivery optimization, vehicle maintenance telematics, and driver safety into a platform priced to guarantee immediate ROI. Request a 1-on-1 walkthrough.
Spatial Stop Density Optimizer
Packs stops into compact micro-territories, reducing transit miles between drops, eliminating unnecessary left turns, and lowering fleet-wide fuel consumption by up to 22%.
Automated Shift Equalization Engine
Balances parcels based on physical package weights, building dwell times, and traffic conditions, ensuring every courier finishes assigned routes within regular scheduled hours.
Predictive Failure Interceptor
Monitors starter cranking voltage drop, alternator ripple, and foundation brake friction wear in real time, moving repairs to evening shop shifts to prevent roadside breakdowns.
Depot Vault Offline Mobile Sync
Drivers scan packages, execute turn-by-turn routes, capture digital signatures, and submit pre-trip eDVIRs in concrete basements with zero cellular coverage; data auto-syncs on departure.
2-Click Midday Stop Offloading
When unexpected traffic or flat tires threaten delivery SLAs, dispatchers transfer at-risk stops across nearby ahead-of-schedule couriers with two clicks, protecting on-time metrics.
Real-Time Cost-Per-Drop Telemetry
Track operating margin down to the specific driver, route, territory, and vehicle chassis, giving executives actionable unit-economics data to negotiate profitable delivery contracts.
Financial Optimization Aligned with Commercial Safety Mandates
FleetRabbit’s cost reduction architecture systematically protects fleets against federal regulatory fines, driver labor disputes, and roadside inspection lockouts.
Integrates mandatory 30-minute rest breaks, 11-hour drive limits, and 14-hour on-duty windows directly into route optimization schedules to eliminate driver fatigue violations.
Standardizes driver pre-trip/post-trip eDVIR walkarounds, qualified brake mechanic sign-offs, and 14-month electronic maintenance file archives to guarantee audit readiness.
Maintains verified electronic shift records, actual driving time stamps, and automated route pacing logs to substantiate payroll compliance and defend against wage disputes.
Calculates package payload distribution against chassis Gross Axle Weight Ratings (GAWR) during manifest creation, preventing roadside scale citations and suspension damage.
Software TCO & ROI Benchmark Comparison
A feature-level comparison focused on software total cost of ownership (TCO), maintenance integration, and financial payback periods as of 2026. Request a technical comparison.
| Capability | FleetRabbit | Generic Fleet CAD | Basic Telematics | Manual Spreadsheets |
|---|---|---|---|---|
| Pricing (per asset/month) | $5/month | $25–$60/month | $15–$35/month | High overtime bloat |
| Average Payback Period | < 45 days | 9–14 months | 18+ months | Negative ROI (cost drain) |
| Verified Net ROI Multiplier | 7.1x verified net return | 1.2x–1.8x marginal | 0.8x (tracking only) | 0x (cost inflation) |
| Predictive Fleet Maintenance | Native CAN-bus failure radar | Requires separate tool | Not supported | None (breakdown driven) |
| Concrete Depot Offline Sync | Full store-and-forward | Network dependent | Data dropped | Paper only |
| Free Trial Access | 14 days, up to 3 assets | Sales demo only | Demo only | None |
| Contract Commitment | Monthly or annual | Multi-year lock-in | 3-year minimum | None |
5-Step Rapid-ROI Implementation Pathway
FleetRabbit embeds cleanly into your parcel operations, dispatch control desks, and courier smartphones in under two weeks without freight disruption.
Baseline Cost Audit & Data Ingestion
Import historical route manifests, payroll overtime records, fuel expenses, and repair invoices to establish an accurate baseline Cost Per Delivery.
Micro-Zone Territory & Dwell Calibration
Configure regional service zones, parcel delivery windows, vehicle payload profiles, and location-specific building dwell times across your target markets.
Predictive Maintenance & eDVIR Setup
Connect OBD-II/J1939 telematics dongles and establish degradation thresholds for battery cranking voltage, foundation brake wear, and pre-trip inspections.
Couriers Mobile Application Rollout
Equip last-mile delivery drivers with the offline-first mobile app on standard iOS or Android smartphones for turn-by-turn routing and proof-of-delivery.
Live Margin Optimization Go-Live
Activate live dispatch monitoring, automated midday stop re-balancing, and 1-click unit-cost reduction dashboards across central control desks.
2-Week Deployment Plan & Milestones
Modernize your last-mile fleet operations and accelerate bottom-line savings with zero disruption to active daily deliveries. Request an onboarding plan.
Week 1: Integration & Cost Modeling
- Sync WMS/TMS parcel order streams, customer delivery tiers, and driver rosters
- Configure vehicle volumetric profiles, payload ratings, and territory boundaries
- Set up pre-trip driver eDVIR checklists and predictive maintenance alert rules
- Assign user access roles for Operations Directors, Dispatchers, and Drivers
Week 2: Depot Rollout & Live Verification
- Distribute mobile app to drivers and conduct 15-minute training on dynamic routing
- Validate store-and-forward offline syncing in concrete loading docks and concourses
- Simulate midday order transfers to verify 2-click dynamic stop re-balancing workflows
- Launch live cost-per-delivery tracking dashboard and automated ROI savings reports
Generate a 7.1x Net ROI on Your Last-Mile Fleet Operations
Compress cost per delivery by $0.45–$0.70 per stop, eliminate driver overtime bloat, and prevent roadside vehicle downtime. Start today at $5/asset/month with a 14-day free trial.
Real-World Fleet Financial Returns
Documented cost savings and ROI metrics reported by commercial parcel carriers and e-commerce 3PL logistics networks. Request the logistics ROI case study.
$107,700 Net Annual Savings Across 50 Delivery Vans
A regional parcel carrier operating 50 delivery vans struggled with unbudgeted overtime payroll and expensive roadside breakdown tow bills. By deploying FleetRabbit for shift equalization and predictive maintenance, the carrier cut overtime hours by 38% and emergency repairs by 40%, generating $107,700 in net annual bottom-line savings on a $3,000 annual software investment.
$0.62 Saved Per Delivery Drop Across 65 Vans
A contract e-commerce fulfillment carrier operating 65 vans faced severe margin compression with an average CPD of $6.84. FleetRabbit introduced micro-zone density clustering and recipient arrival notifications, driving average CPD down to $6.22 and saving $144,000 in operating expenses in year one.
When you manage a delivery fleet, enterprise software vendors try to charge you thirty to fifty dollars per van every month, demanding long-term contracts and massive upfront implementation fees that take years to pay off. FleetRabbit turned that model upside down. At five dollars per van per month, the financial business case was an absolute no-brainer for our board. It paid for itself in the first thirty days just from the overtime we eliminated on our Monday and Friday delivery shifts. When you factor in the roadside breakdowns we prevented through predictive battery and brake alerts, FleetRabbit generated over seven times its cost in net bottom-line savings in year one. It is the most profitable software investment our logistics business has ever made.
Frequently Asked Questions
Build Your Fleet's Winning Business Case in Less Than 2 Weeks
Generate a 7.1x net ROI, eliminate driver overtime bloat, and prevent roadside vehicle downtime at $5/asset/month with a 14-day free trial.







