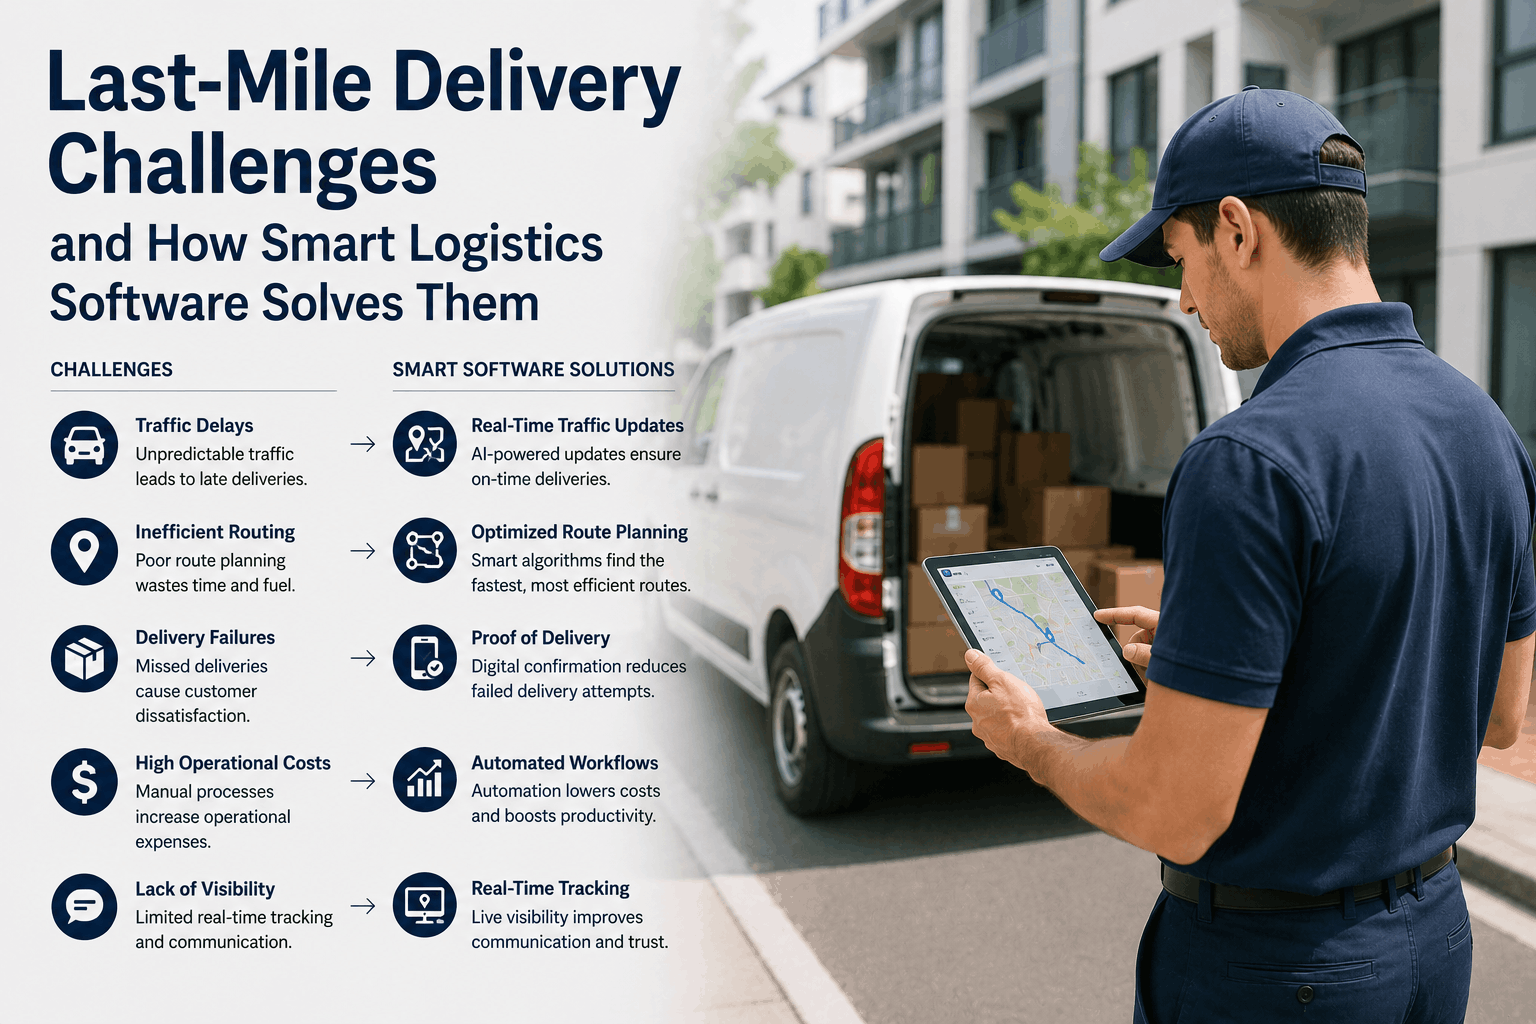
Last-mile delivery is where e-commerce businesses win or lose customers — permanently. In the western US, where urban sprawl stretches from Los Angeles to Phoenix, Seattle to Denver, the final stretch between warehouse and doorstep swallows 53% of total logistics cost while determining whether a buyer clicks "reorder" or leaves a one-star review. The math is brutal: one failed delivery costs $8–$14 in re-dispatch. One churned customer costs $180+ in lifetime value. And with 8–12% of urban residential deliveries failing on the first attempt, the losses compound daily. Smart logistics software doesn't patch individual problems — it attacks all six last-mile pain points simultaneously. Book a demo to see Fleet Rabbit solving last-mile challenges across your operation.
The Bottom Line
The six last-mile challenges costing US e-commerce operations the most — failed deliveries, route inefficiency, SLA breaches, fuel waste, dispatch blind spots, and vehicle downtime — all share a common root: decisions made without real-time data. Fleet Rabbit's logistics platform connects live GPS, AI route optimization, driver analytics, and predictive maintenance into one system that turns reactive firefighting into proactive delivery performance. Operations see 18–25% lower cost per delivery and 18–24% better on-time rates within 90 days.
The Last-Mile Cost Problem — Visualized
Before mapping solutions, it helps to see exactly where last-mile cost concentrates. For a typical 50-vehicle US e-commerce fleet, the breakdown looks like this:
Where Last-Mile Cost Goes — 50-Vehicle US Fleet (Annual)
Fuel & Vehicle Operating
$620K
Driver Labor & Overtime
$560K
Failed Delivery Re-Attempts
$360K
SLA Penalties & Refunds
$240K
Vehicle Maintenance & Breakdowns
$140K
Dispatch & Admin Overhead
$80K
Red bars = directly preventable with logistics software. Amber = partially reducible. Combined opportunity: $820K+/year.
Challenge #1 — Failed Deliveries: The $360K Leak
No one talks about failed deliveries as a budget line item. They should. At 10% first-attempt failure rates across western US urban routes, a 50-vehicle fleet hemorrhages over $360K annually on re-dispatch, re-routing fuel, customer service calls, and expedited redeliveries.
Why It Happens
- Vehicles arriving outside customer availability windows
- No real-time ETA — customers can't plan around a 9 AM–5 PM window
- No pre-arrival notification giving the customer time to prepare
- Static route plans don't adapt when traffic pushes arrival times
How Fleet Rabbit Fixes It
- Time-window matching — routes assigned so planned arrival aligns with customer availability
- Live ETA notifications — customers receive 30-minute accurate arrival windows from actual vehicle position
- Dynamic rerouting — when traffic delays threaten a window, dispatch gets alerted to reassign before the window closes
28–35%
Fewer Failed Deliveries
$100K+
Annual Re-Delivery Savings (50 vehicles)
84%
Of US customers won't return after 2 failures
Challenge #2 — Route Inefficiency: Paying for Miles You Don't Need to Drive
Manual dispatch — dispatchers drawing on maps, drivers choosing their own sequences — produces routes 15–25% longer than algorithmically optimized equivalents. In California, Texas, and Arizona where delivery zones sprawl across metro areas, every unnecessary mile multiplies: fuel, driver hours, vehicle wear, and opportunity cost of stops not completed.
Without Optimization
180 km/day avg per vehicle
Driver chooses own sequence → backtracks across zones → 22% excess distance → $295/vehicle/day in preventable fuel cost
→
With Fleet Rabbit
148 km/day avg per vehicle
AI sequences stops by geographic zone → eliminates backtracking → 32 km saved/day → $89,760/year savings on 50 vehicles from distance alone
15–20%
Distance Reduction Per Route
22–30%
Total Fuel Cost Reduction
15–20%
More Stops Per Vehicle Per Shift
Challenge #3 — SLA Breaches: When Promises Become Penalties
For US e-commerce businesses supplying Amazon, Walmart, or major retail chains, SLA compliance isn't a performance metric — it's a financial contract. Miss a delivery window and chargebacks trigger automatically. In the western US, where same-day and next-day delivery expectations are highest, SLA breach rates above 6% can cost operations six figures annually in penalties before customer churn is even counted.
1
Morning: Routes Planned With Realistic Completion Times
Fleet Rabbit builds routes using historical dwell times per stop type — residential vs. commercial, elevator vs. ground floor, signature-required vs. drop-off — not optimistic flat estimates. Routes impossible to complete within SLA windows are flagged before vehicles leave the depot.
2
In-Transit: Real-Time ETA Accuracy Monitoring
As vehicles move, Fleet Rabbit continuously recalculates ETA against SLA windows. Dispatchers see a live "at-risk" dashboard — vehicles where current pace puts SLA delivery in jeopardy — with enough lead time to reroute or reassign stops before the window expires.
3
Post-Shift: Pattern Analytics to Fix Structural SLA Failures
Fleet Rabbit records SLA compliance by route, driver, delivery type, and time window — identifying the specific stops and patterns where breach risk concentrates. Route 14 missing its 3 PM window consistently isn't bad luck — it's 3 apartment stops averaging 8-minute dwell that analytics surface, enabling a permanent fix.
Fleet Rabbit customers report 18–24% improvement in on-time delivery rate within 60 days of deployment.
Stop SLA Breaches Before They Happen
Real-Time At-Risk Monitoring + AI Route Planning — Built for US Last-Mile Operations
Fleet Rabbit gives dispatchers live visibility into SLA risk across every active vehicle — with automated alerts and rerouting tools that intercept delivery failures before windows close.
18–24%
On-Time Rate Improvement
90 days
To Full Optimization Effect
Challenge #4 — Fuel Waste: The Cost That Compounds Every Day
Western US fuel prices consistently run 15–30% above the national average. In California and Washington, diesel sits above $5/gallon. For a 50-vehicle fleet averaging 180 km/day at 12L/100km, fuel spend reaches $1.7M+ annually — with 22–30% of that entirely preventable through smarter routing and driver behavior management.
Stop-and-Go Burns 40–60% More Fuel Per KM
Fleet Rabbit routes vehicles around congestion even when alternate routes are marginally longer. A 3km congested corridor vs. a 4km free-flowing alternative: the longer route uses 50% less fuel and saves 16+ minutes — enabling one additional stop. Live traffic data feeds every route decision continuously throughout the shift.
Aggressive Driving Adds 15–25% Fuel Overhead
Harsh acceleration, hard braking, and over-speed events inflate fuel consumption on identical routes. Fleet Rabbit's driver scorecard gives dispatchers specific data — "your aggressive acceleration Tuesday cost $47 extra on Route 9" — turning vague coaching into targeted improvement with measurable fuel reduction within 30 days.
$22–35 Per Idle Hour — With Zero Delivery Progress
Delivery vehicles idle during double-parking waits, between-stop breaks, and pre-shift warmup. Fleet Rabbit's idle monitoring identifies drivers and routes with above-average idle percentage, separating structural route issues (needing redesign) from behavior-driven idle (needing coaching). Idle reduction delivers $1,800–$3,200 per vehicle annually.
Under-Loaded Vehicles = Paying Full Fuel for Half the Value
Manual dispatch assigns delivery volume without optimizing load fill rate — some vehicles leave at 65% capacity while others need mid-route offloading. Fleet Rabbit's load optimization targets 85%+ fill rate per vehicle, reducing the total vehicles needed for daily volume and cutting fuel cost per delivery delivered.
Challenge #5 — Dispatch Blind Spots: Managing 20 Vehicles by Phone
A dispatcher managing 20+ vehicles simultaneously without live data is making decisions in the dark — calling drivers for status updates, estimating ETAs from memory, discovering overtime at shift end instead of preventing it at noon. In fast-moving western US metro markets, that information gap translates directly into delivery failures and unnecessary labor cost.
From Phone-Based Guesswork to Live Operational Intelligence
Fleet Rabbit's dispatch dashboard shows every vehicle position, current stop, remaining stops, ETA accuracy, and emerging alerts on a single live map. One dispatcher with Fleet Rabbit can manage 25–30 vehicles effectively — without it, coordination failures begin appearing at 10–12 vehicles. Alert types include: vehicle running 20+ minutes behind SLA window, driver idle for 18+ minutes, engine fault code detected, stop dwell time exceeding threshold, and route completion projected past shift hours — all surfaced automatically so dispatchers can act, not search.
25–30
Vehicles Per Dispatcher (with Fleet Rabbit)
10–12
Vehicles Per Dispatcher (without live data)
60–75%
Overtime Routes Eliminated
Challenge #6 — Vehicle Downtime: When Your Asset Becomes a Liability at 2 PM
A delivery van breaking down during the 2–6 PM peak delivery window in Los Angeles or Seattle doesn't just stop delivering — it triggers a cascade. Emergency towing at premium rates, failed deliveries on 10–16 stops, expedited customer service, and same-day redelivery attempts costing 3–5x standard delivery. Each breakdown event costs $18,000–$32,000 in direct and indirect impact. On a 50-vehicle fleet averaging 3–4 unmonitored breakdowns per year, that's $2.7M–$6.4M in avoidable annual exposure.
Reactive Maintenance
3–4 breakdowns/vehicle/year
Driver notices warning light → calls dispatch mid-route → tow truck dispatched → 12–16 deliveries failed → emergency redelivery attempts → customer service surge → $18K–$32K per event
→
Fleet Rabbit Predictive
40% fewer breakdown events
Continuous OBD-II monitoring → fault codes detected 1–3 weeks before failure → maintenance scheduled overnight → zero mid-route breakdowns → $21,600–$51,200 saved per vehicle per year
The Combined Impact: All 6 Challenges, One Platform
The compounding effect of solving all six last-mile challenges simultaneously is what separates logistics software ROI from what individual point solutions deliver. Here's what full Fleet Rabbit deployment produces for a 50-vehicle US operation:
18–25%
Lower Cost Per Delivery
22–30%
Fuel Cost Reduction
28–35%
Fewer Failed Deliveries
18–24%
On-Time Rate Improvement
15–20%
More Stops Per Shift
50-Vehicle Fleet — Estimated Annual Savings Breakdown
Fuel optimization (22–30% reduction)$374K–$510K
Failed delivery elimination (28–35%)$101K–$126K
Overtime reduction (60–75% of routes)$97K–$173K
Predictive maintenance savings$54K–$128K
Total Estimated Annual Savings$626K–$937K
Frequently Asked Questions
QHow quickly does Fleet Rabbit show measurable impact on last-mile challenges?
Fuel and distance savings appear from day one — the first optimized route is shorter than the manual equivalent immediately. Failed delivery reduction through time-window matching is measurable within the first week. Overtime elimination and dispatch efficiency improvements emerge within 30 days. Full analytics-driven pattern identification — which routes and drivers are systematically underperforming — reaches actionable quality by week 3–4. Complete ROI, where total savings exceed subscription cost, occurs within 45–60 days for most US e-commerce operations.
QDoes Fleet Rabbit integrate with our existing OMS and delivery management systems?
Fleet Rabbit integrates via API with major US order management systems — pulling daily delivery manifests automatically so dispatchers don't manually re-enter stop data. The implementation team handles OMS integration during the first week of deployment. For operations using custom or legacy systems, Fleet Rabbit supports CSV import workflows that maintain automation without requiring API development. The platform requires three inputs to generate optimized routes from day one: delivery addresses with time windows, vehicle list with capacity specs, and depot locations.
QHow does Fleet Rabbit handle peak volumes — Black Friday, Prime Day, holiday surge?
Fleet Rabbit's optimization engine handles 2–5x normal delivery volume with the same route quality and speed as regular operations — the algorithm doesn't degrade under load. For peak planning, Fleet Rabbit's capacity analysis shows exactly how many vehicles and shifts are required to complete projected volume within delivery window commitments, identifying where renting additional vehicles beats extending shift hours. Pre-event route templates can be prepared for high-volume zones, cutting morning dispatch time on peak days when operations need to move fast.
Related Fleet Rabbit Resources
The four AI capabilities reshaping e-commerce fleet operations — GPS visibility, predictive health monitoring, dynamic route optimization, and delivery analytics — with ROI data for each layer.
A deep dive into all ten route optimization levers — from distance reduction and fuel savings to predictive maintenance and dynamic dispatch — with 18–25% total cost reduction benchmarks.
AI-driven fault prediction and overnight maintenance scheduling that prevents mid-route breakdowns from destroying peak-hour delivery performance.
How GPS hardware, IoT vehicle data, and cloud analytics combine into the real-time fleet intelligence that makes every last-mile software solution in this guide possible.
Every Last-Mile Challenge Has a Software Solution — See Fleet Rabbit Solve All Six
Fleet Rabbit's platform addresses failed deliveries, route inefficiency, SLA breaches, fuel waste, dispatch blind spots, and vehicle downtime through one integrated system. Most US operations recover full platform cost within 45–60 days through fuel and failed-delivery savings alone.
28–35% Fewer Failed Deliveries
22–30% Fuel Savings
Live SLA Monitoring
Predictive Maintenance
45–60 Day ROI
May 25, 2026
By Michael Finn
All Posts