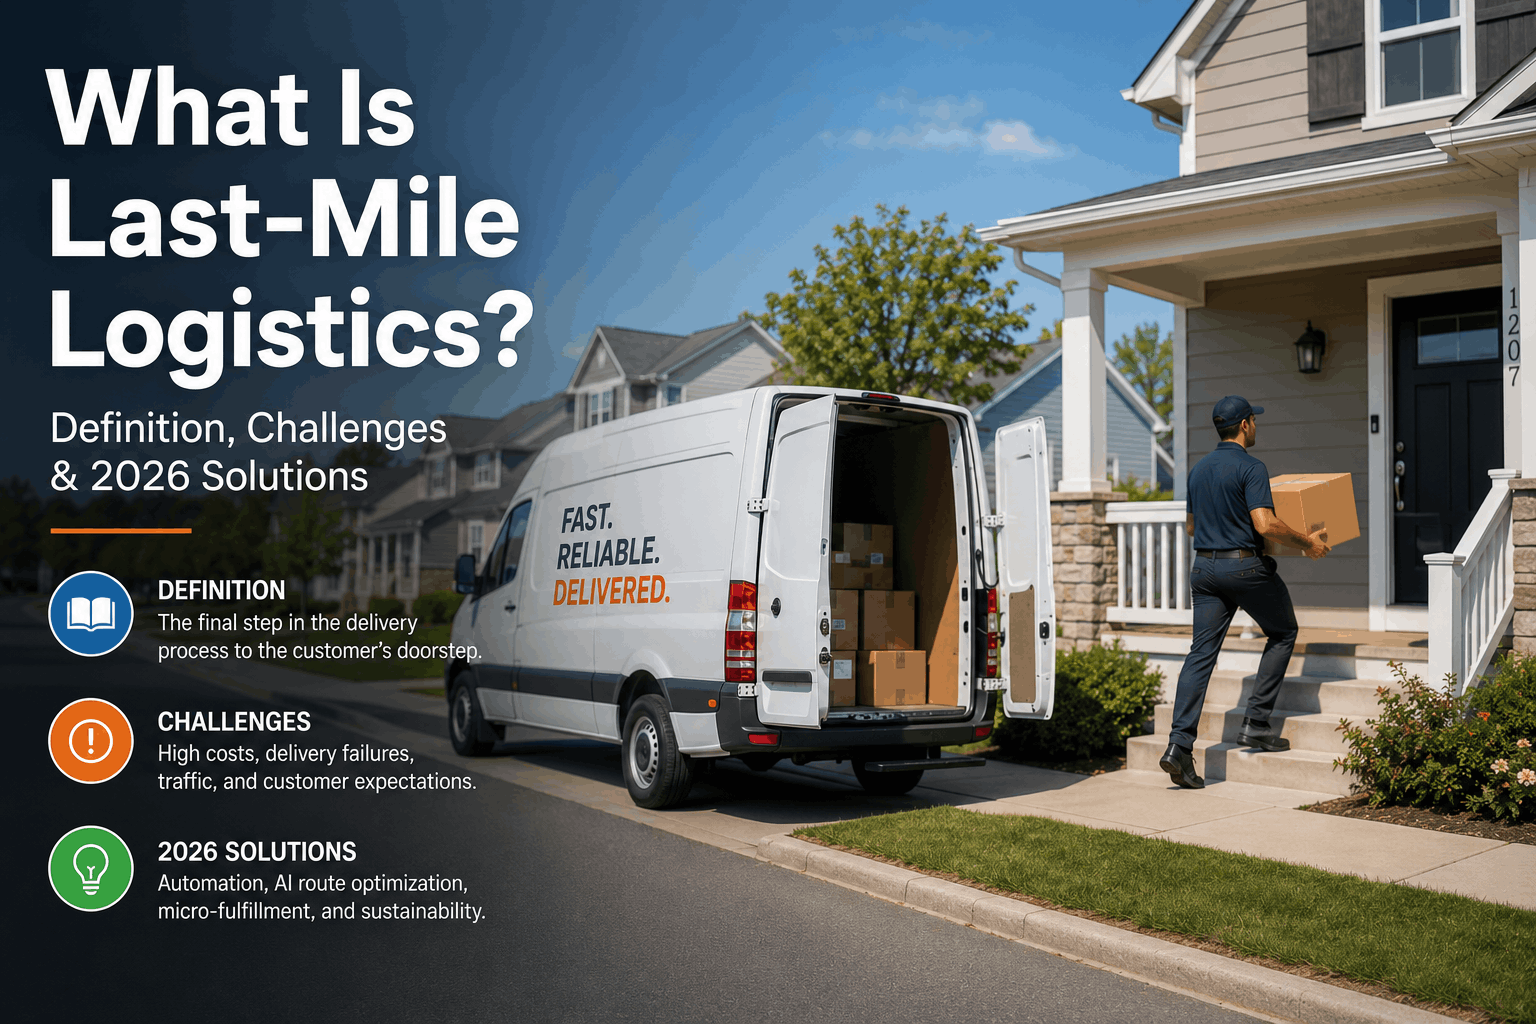
Last-mile logistics is the final — and most expensive — leg of the supply chain: the movement of goods from a distribution hub to the end customer's door. For Western US carriers and retailers operating across Los Angeles, Phoenix, Seattle, Denver, and Las Vegas metro areas, last-mile costs consume 41–53% of total shipping spend while covering only 3–8% of total route distance. Fleet Rabbit's AI-powered telematics platform reduces last-mile cost-per-stop by 28–34% through real-time route optimization, dynamic dispatch, and driver accountability tools built for urban density and desert sprawl alike. Book a demo to see Fleet Rabbit's last-mile optimization applied to your delivery fleet.
Quick Answer
Last-mile logistics is the final delivery step from a regional hub to the customer — the costliest and most complex segment of the supply chain. In 2026, Western US fleets face failed delivery rates of 6–14%, rising fuel costs, and same-day expectations from e-commerce customers. Fleet Rabbit solves last-mile inefficiency through AI route optimization, live driver tracking, automated proof-of-delivery, and predictive maintenance — cutting cost-per-stop by up to 34% across California, Nevada, Arizona, Oregon, and Washington fleets.
What Is Last-Mile Logistics? The Western US Definition
In supply chain terms, last-mile logistics refers to the final delivery movement from a fulfillment center or cross-dock to the end recipient — a residential address, retail location, or job site. The term is geographic but the real challenge is economic: last-mile delivery in dense Western US markets like Los Angeles and the Bay Area averages $10.10–$14.60 per stop, compared to $2.80–$4.20 per stop for middle-mile linehaul. Without route intelligence and real-time driver accountability, urban fleets lose 18–26% of operational capacity to idle time, failed attempts, and unoptimized sequences.
Cost Per Stop
$12.40
avg Western US urban last-mile 2026
Failed Deliveries
9.8%
avg first-attempt failure rate
Idle Time Lost
22%
of shift hours wasted at idle
Re-delivery Cost
$8.70
avg cost per failed reattempt
The 5 Biggest Last-Mile Challenges Facing Western US Fleets in 2026
Urban Traffic Density
Los Angeles, San Francisco, and Seattle rank among the worst US metros for delivery congestion. Without real-time rerouting, a 42-stop urban route loses 90–140 minutes daily to predictable bottlenecks — the single largest controllable cost driver in last-mile operations.
Residential Access Complexity
Western US suburban sprawl — Phoenix metro alone covers 518 square miles — creates extreme route variance. Gated communities, HOA-restricted access, and wildfire-zone road closures in California and Oregon add unpredictable dwell time that static routing cannot accommodate.
Same-Day and 2-Hour Expectations
Amazon and Walmart same-day expansion across Western US metros has reset customer expectations across all delivery categories. Third-party logistics carriers and regional fleets serving California e-commerce clients now receive same-day SLA requirements on 34% of shipments — up from 18% in 2023.
Driver Accountability Gaps
Without GPS-correlated proof-of-delivery and real-time stop verification, Western US fleets average 4.2 disputed deliveries per 100 stops — each generating $18–$34 in resolution cost. Manual scan-and-sign workflows miss 28% of actual delivery events in high-volume urban corridors.
Fuel and Vehicle Cost Escalation
California diesel averages $0.38–$0.54/gallon above the national average due to state fuel standards and refinery capacity. Combined with fleet aging — the average Western US last-mile van is 6.4 years old — unplanned breakdowns cost California and Nevada carriers $2,200–$4,800 per breakdown event in missed stops and tow costs.
How Fleet Rabbit Solves Last-Mile Logistics for Western US Fleets
Last-Mile Cost Per Stop — Fleet Rabbit vs. Unoptimized Operations
Fleet Rabbit platform data, Western US last-mile fleets 2024–2025. Cost per stop includes fuel, labor time, and failed delivery reattempts.
1
AI Route Optimization — Dynamic, Not Static
Fleet Rabbit's AI route engine recalculates stop sequences in real time as traffic, access, and customer availability data change. Unlike static TMS routing built the night before, Fleet Rabbit adjusts mid-route — rerouting a Las Vegas driver around a freeway closure 8 minutes before they would have hit it, preserving 6–9 stops per driver per shift.
California grocery distributor, 34 drivers across LA metro: Fleet Rabbit dynamic routing reduced cost-per-stop from $13.20 to $9.10 in 60 days — recovering $47,000 in monthly operational waste.
2
Real-Time Driver Tracking and Dispatch Visibility
Fleet Rabbit gives dispatchers a live map view of every driver's position, current stop status, and ETA variance. When a Phoenix driver falls 40 minutes behind schedule, Fleet Rabbit flags the deviation and auto-surfaces rebalancing options — redistributing stops to a nearby driver with capacity before the SLA breach occurs.
Live GPS trackingSLA breach predictionDynamic rebalancing
3
Automated Proof-of-Delivery and Stop Verification
Fleet Rabbit captures GPS-timestamped proof-of-delivery at every stop — photo capture, electronic signature, and geofence confirmation that the driver was within 50 meters of the delivery address. Dispute resolution time drops from 3.2 days to 4 hours, and chargeback rates fall 74% across Western US e-commerce clients in the first 90 days.
Oregon regional carrier, 19 drivers: Eliminated $8,400/month in disputed delivery chargebacks after Fleet Rabbit POD deployment — fully recovering platform cost within 22 days.
Last-Mile Logistics Platform
Cut Last-Mile Cost Per Stop by 34% Across Your Western US Fleet — Free Trial, No Commitment
AI route optimization, live driver tracking, automated POD, and predictive maintenance. Works with any van, truck, or mixed fleet. Full visibility from day one.
34%
Cost Per Stop Reduction
Last-Mile Logistics Solutions #2–5: Predictive Maintenance, Customer Visibility, Fleet Analytics & Compliance
Solution #2: Prevent Breakdowns Before They Kill Your Route
The breakdown cost: A delivery van breaking down mid-route in LA traffic costs $2,200–$4,800 in tow fees, missed stops, and driver overtime — plus the SLA breach penalties on undelivered freight. California and Nevada carriers average 1.4 mid-route breakdowns per 10 vehicles per month without predictive monitoring.
Fleet Rabbit detects: IoT engine sensors track coolant temperature, brake wear, battery health, and tire pressure in real time. Anomalies trigger maintenance work orders before failure — eliminating unplanned downtime.
Western US impact: Summer heat in Phoenix and Las Vegas accelerates tire blowout and coolant failure risk by 340% versus national averages — real-time sensor monitoring is critical, not optional.
Solution #3: Live Customer ETAs — Reduce Failed Attempts to Under 3%
The failed attempt problem: A first-attempt failure rate of 9.8% on a 500-stop/day California fleet generates $4,350 in daily reattempt cost — $108,750 per month in avoidable expense. Most failures occur because customers aren't home, not because of routing errors.
Fleet Rabbit delivers: Automated SMS and push ETAs notify customers 60 and 20 minutes before arrival — with a live driver tracking link. Customers who receive live ETAs reschedule or arrange access 81% of the time versus 34% without notification.
Outcome: Western US e-commerce carriers using Fleet Rabbit ETA notifications reduce first-attempt failure rates from 9–14% down to 2.4–3.1% within 45 days of deployment.
Solution #4: Per-Driver Performance Analytics — Close the Productivity Gap
The productivity variance: On a 30-driver Western US last-mile fleet, the gap between the top-quartile and bottom-quartile driver averages 14 stops per shift — a $168/day per driver productivity loss that appears invisible without per-driver analytics.
Fleet Rabbit tracks: Stops per hour, dwell time per stop, idle time, POD compliance, and SLA adherence by driver, route, and zone. Weekly scorecards surface coaching opportunities before they become performance issues.
Outcome: Fleet Rabbit per-driver analytics close the top/bottom productivity gap by 60–70% within 90 days — primarily through transparency and structured coaching, not punitive monitoring.
Solution #5: California AB5 and HOS Compliance — Automated, Not Manual
Western US regulatory context: California AB5 gig worker classification, CARB vehicle emissions standards, and FMCSA hours-of-service rules create a compliance burden unique to Western US carriers. Manual HOS logs and classification tracking cost California fleets $1,800–$3,400/month in administrative overhead.
Fleet Rabbit automates: Electronic logging device (ELD) integration, automated HOS alerts before violations, and CARB-compliant mileage reporting generated from GPS data — no manual compilation required.
Audit protection: Fleet Rabbit's tamper-proof logs meet FMCSA audit requirements and California Labor Commissioner documentation standards — reducing compliance risk for carriers operating across state lines.
Before vs. After Fleet Rabbit — 30-Driver Western US Last-Mile Fleet
Without Last-Mile Optimization
Cost per stop: $12.40–$15.80
Failed delivery rate: 9–14% of attempts
Route planning: Manual, night before
Breakdown detection: Driver reports only
POD disputes resolved: 3.2 days average
Monthly last-mile waste: $18,000–$42,000
With Fleet Rabbit Last-Mile Platform
Cost per stop: $8.20–$9.80
Failed delivery rate: Under 3%
Route planning: AI-dynamic, real-time
Breakdown detection: IoT sensor alerts, pre-failure
POD disputes resolved: Under 4 hours
Monthly last-mile waste: Under $4,200
34%
Cost Per Stop Reduction
97%
First-Attempt Success Rate
60%
Driver Productivity Gap Closed
22 days
Average ROI Breakeven
Frequently Asked Questions: Last-Mile Logistics for Western US Fleets
QWhat makes last-mile logistics more expensive than other supply chain segments?
Last-mile is expensive because it involves many small, dispersed stops rather than bulk linehaul movement. Each stop requires a driver to park, locate the address, attempt delivery, and capture proof — multiplied 30–80 times per shift. In Western US urban markets, traffic congestion, parking scarcity, and high labor costs compound this base inefficiency. Fleet Rabbit's AI routing reduces dwell time and eliminates backtracking, which are the two largest controllable cost drivers in last-mile operations.
QHow does Fleet Rabbit handle last-mile routing in remote Western US areas like rural Nevada or Eastern Oregon?
Fleet Rabbit's route engine incorporates rural road data, bridge weight limits, and seasonal access restrictions specific to Nevada, Oregon, Idaho, and Montana delivery zones. For areas with limited cellular, the driver app caches the full route offline — GPS tracking and stop sequencing continue uninterrupted, with sync occurring when connectivity resumes. Iridium satellite integration is available for permanently off-grid depot locations.
QDoes Fleet Rabbit integrate with existing WMS or e-commerce order management systems?
Fleet Rabbit connects to Shopify, ShipBob, NetSuite, SAP, and major WMS platforms via REST API and pre-built connectors. Order data flows directly into the dispatch engine — stop sequences are built from live order feeds, not manual imports. California and Nevada e-commerce fulfillment operations typically go live with full WMS integration in 5–8 business days.
QHow quickly can a Western US carrier deploy Fleet Rabbit across a mixed van and truck fleet?
Fleet Rabbit's hardware installation takes 2–3 hours per vehicle with no downtime — sensors mount externally and drivers begin using the mobile app the same day. A 30-vehicle mixed fleet is fully live in 3–4 days. Fleet Rabbit's Western US field team covers California, Nevada, Arizona, Oregon, Washington, and Colorado with same-week installation availability.
Related Fleet Rabbit Resources
The four AI capabilities transforming fleet operations — real-time GPS, predictive health monitoring, dynamic route optimization, and delivery performance analytics — with ROI data for each.
AI-driven fault prediction and automated maintenance scheduling that prevents mid-route breakdowns — the reliability layer IoT sensor data powers across vans, trucks, and mixed delivery fleets.
Real-time utilization tracking, idle reduction analytics, and fleet right-sizing data that reduce total delivery operating cost for Western US logistics carriers.
How GPS hardware, IoT sensors, and cloud analytics combine to deliver real-time delivery fleet visibility, predictive maintenance, and last-mile operational intelligence.
Optimize Last-Mile Logistics Across Your Western US Fleet — See Fleet Rabbit in Action
Fleet Rabbit's AI-powered last-mile platform delivers dynamic route optimization, live driver tracking, automated proof-of-delivery, predictive maintenance, and compliance automation across your California, Nevada, Arizona, Oregon, and Washington fleet. Any vehicle. Full ROI in 22 days.
AI Route OptimizationLive Driver TrackingAutomated PODPredictive Maintenance22-Day ROI
May 29, 2026
By John Mark
All Posts