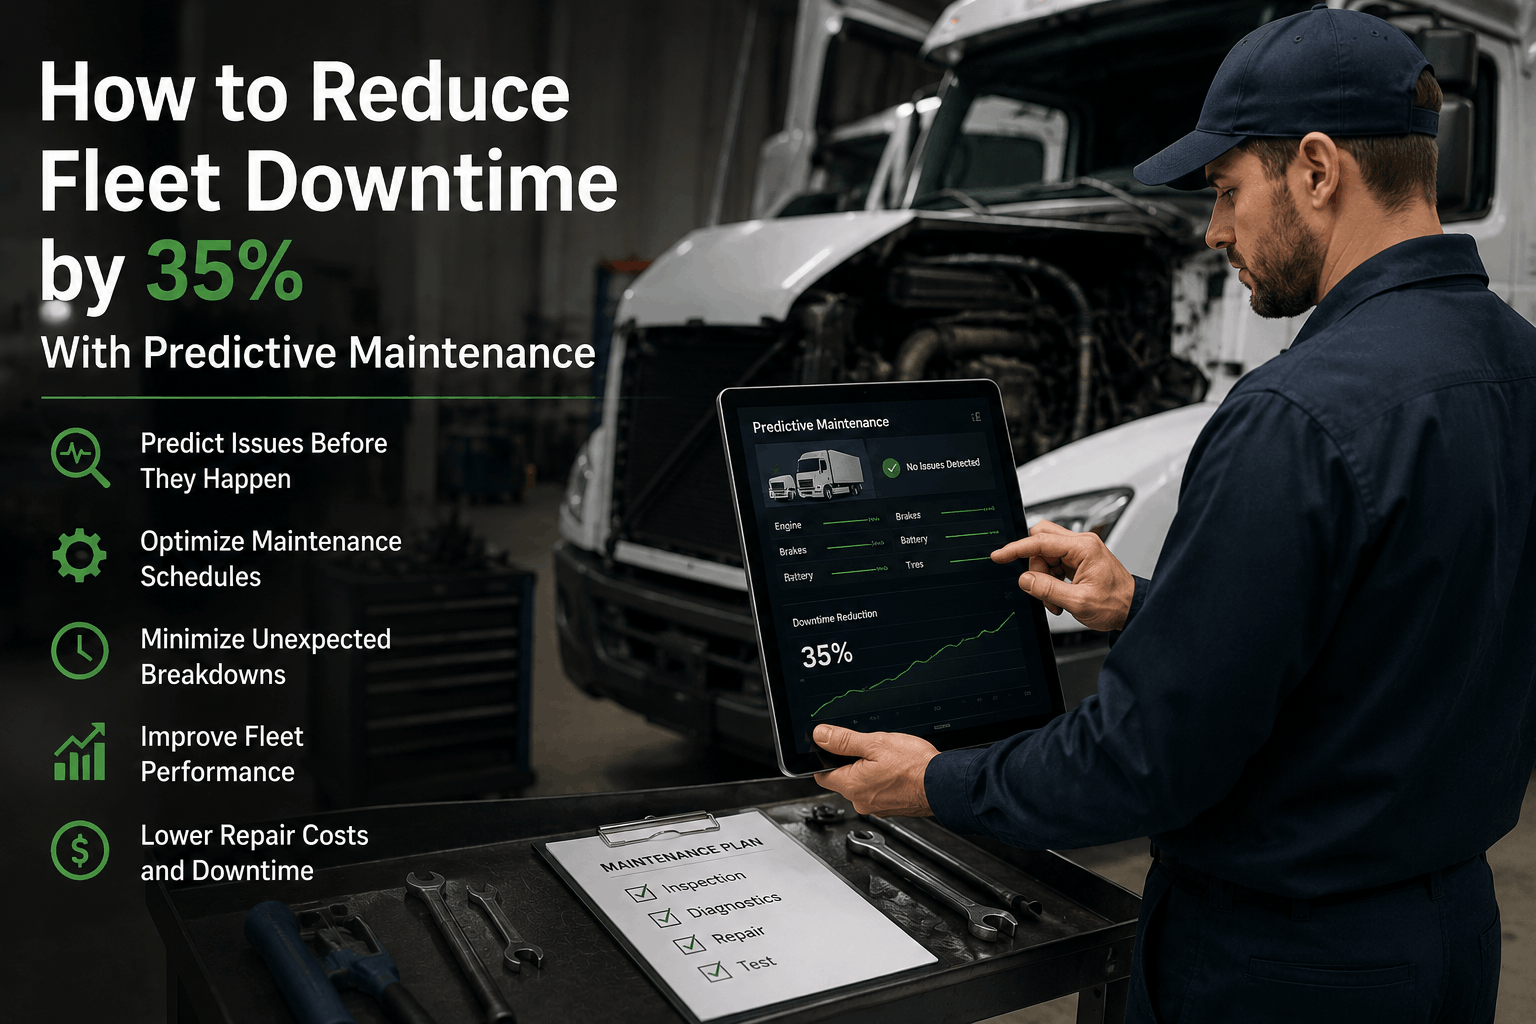
Unplanned vehicle downtime is the silent margin killer in last-mile delivery — costing U.S. fleet operators an average of $760 per breakdown event in direct repair, towing, and emergency labor, while simultaneously failing 10–18 customer deliveries loaded on that vehicle. Predictive maintenance changes the equation: instead of reacting to breakdowns after they happen, fleet telematics continuously monitors engine health, fault codes, battery voltage, brake wear, and transmission stress — flagging developing issues 1–3 weeks before they strand vehicles. Fleet operations that deploy predictive maintenance reduce unplanned breakdowns 35–42%, cut total vehicle maintenance cost 18–25%, and eliminate catastrophic mid-route failure events that destroy customer promise rates. Fleet Rabbit's predictive maintenance platform integrates real-time vehicle health monitoring, fault code interpretation, automated maintenance scheduling, and driver behavior analysis in one system — built for the reliability demands of high-frequency urban delivery fleets. Book a demo to see Fleet Rabbit's predictive maintenance applied to your delivery fleet.
Quick Answer
Predictive maintenance reduces fleet downtime 35% through six mechanisms: continuous engine and component health monitoring that detects faults 1–3 weeks early, automated maintenance scheduling that eliminates missed service intervals, driver behavior scoring that prevents aggressive driving from accelerating wear, battery and electrical monitoring that prevents no-start events, brake and tire wear tracking that prevents roadside failures, and fleet-wide analytics that identify vehicle-class patterns requiring proactive intervention. U.S. delivery fleets using Fleet Rabbit's predictive maintenance recover full platform cost within 60–90 days through prevented breakdown events alone.
The Real Cost of Unplanned Fleet Downtime
Most fleet managers track direct repair costs — parts, labor, towing. Few track the full cost of a single mid-route breakdown: failed deliveries, emergency redeployment, driver overtime, customer service handling, and next-day redelivery attempts that multiply the original repair bill 4–6x.
Direct Breakdown Cost per Event
Emergency towing ($180–$320), roadside labor ($240–$480 at premium rates), and parts at 15–25% above scheduled pricing. Direct per-event cost: $760–$1,200 versus $180–$280 for the same repair done proactively during scheduled downtime.
Delivery Failure Cascade Cost
A vehicle breaking down at stop 9 of 22 fails 13 remaining deliveries. At $8.40 average redelivery cost per failed attempt plus $45–$80 in customer service handling, a single breakdown cascades into $109–$192 in downstream delivery failure cost — on top of repair expenses.
Annual Cost on a 50-Vehicle Fleet
U.S. delivery fleets average 3.8 unplanned breakdown events per vehicle annually. On a 50-vehicle fleet, that's 190 events at $870–$1,392 true cost each = $165,300–$264,480 in preventable annual cost. A 35% reduction saves $57,855–$92,568 per year.
Way #1: Continuous Engine Health Monitoring — Catch Faults 1–3 Weeks Early
The highest-impact predictive maintenance capability reads vehicle fault codes and sensor data continuously rather than waiting for the check-engine light. OBD-II and CAN bus streams contain early warning signals for developing mechanical failures weeks before they cause roadside breakdowns.
1
Real-Time Fault Code Monitoring and Severity Classification
Fleet Rabbit reads engine fault codes continuously — classifying each by severity and expected failure timeline. A P0420 catalyst code might indicate 3–6 weeks before degradation. A P0300 misfire code demands same-week attention. Automated classification means dispatchers see actionable alerts, not raw code strings.
Phoenix fleet example: Fault monitoring flagged P0087 (fuel pressure low) on vehicle #23 during Tuesday dispatch. Repair scheduled Thursday off-hours: $340 fuel pump replacement. Without monitoring, projected failure: 8–12 days during peak window. Prevented breakdown value: $1,140 in avoided costs.
2
Engine Temperature and Oil Pressure Trend Analysis
Single-point readings miss gradual drift patterns that precede major failures. Fleet Rabbit monitors temperature and pressure trends over time — flagging vehicles running 8–12°F higher than fleet baseline or showing oil pressure 4–6 PSI below historical normal. Trend deviation alerts catch developing problems before they cross hard failure limits.
Trend monitoring: 2–3 weeks earlyThreshold alerts: 2–5 daysCombined: 35% breakdown reduction
3
Transmission and Drivetrain Stress Monitoring
Urban delivery duty cycles stress transmissions at 2.3x the rate of highway use. Fleet Rabbit monitors transmission temperature spikes and shift irregularities indicating developing failure. Transmission repairs run $2,800–$5,400 per event — a single prevented failure pays months of platform subscription.
Engine health monitoring accounts for 40–50% of the total 35% breakdown reduction — the highest-leverage capability for urban delivery fleets.
Predictive Maintenance + Fleet Telematics
Reduce Fleet Breakdowns 35% — Starting From Week One
Fleet Rabbit monitors engine health, fault codes, battery status, and driver behavior continuously — flagging developing issues before they become roadside emergencies, for any U.S. delivery fleet size.
35–42%
Breakdown Reduction
18–25%
Maintenance Cost Savings
Ways #2–5: Four Additional Downtime Reduction Mechanisms
Engine health monitoring is the highest-impact layer, but four additional mechanisms account for the remaining 50–60% of downtime reduction — addressing electrical failures, driver-driven wear, missed service intervals, and brake and tire events.
Way #2: Battery and Electrical Monitoring — Eliminate No-Start Events
The problem: Dead batteries cause 28–35% of all unplanned downtime events in U.S. delivery fleets. Urban stop-start duty cycles drain batteries 40% faster than highway use, making standard 3-year replacement schedules unreliable.
How monitoring fixes it: Fleet Rabbit monitors battery voltage and cold-cranking amp capacity — flagging batteries showing degradation 3–5 weeks before failure. Alternator irregularities are caught before they strand vehicles mid-route.
Measured outcome: 60–75% reduction in battery no-start events. On a 50-vehicle fleet averaging 8 battery failures annually, monitoring prevents 5–6 events per year — saving $4,200–$6,800 in roadside service and disruption costs.
Way #3: Driver Behavior Scoring — Stop Accelerated Component Wear
The problem: Hard braking and rapid acceleration accelerate brake wear 2.4x, increase transmission stress 1.8x, and raise engine wear 20–30%. Driver-driven wear explains why identical vehicles on the same fleet have breakdown rates that vary 3x between drivers.
How monitoring fixes it: Fleet Rabbit scores harsh braking, aggressive acceleration, and over-RPM incidents per driver and route. Coaching shifts from "drive carefully" to "your harsh braking on Route 12 generates $340/month in excess brake wear."
Measured outcome: 18–28% reduction in brake replacement frequency and 12–18% reduction in transmission service events within 90 days of coaching implementation.
Way #4: Automated Maintenance Scheduling — Zero Missed Intervals
The problem: Urban delivery vehicles accumulate service intervals 40–60% faster than highway use — needing oil changes every 45–55 days, not 90. Manual spreadsheet tracking produces missed intervals that accelerate engine wear and void manufacturer warranties.
How Fleet Rabbit fixes it: Schedules are built from actual odometer readings and engine hours. Automated alerts reach managers 7 days and 48 hours before each service interval, with direct scheduling integration.
Measured outcome: 95–100% service interval compliance versus 72–78% on manual systems. Interval compliance alone reduces major engine failure rates 22–30% in high-cycle urban fleets.
Way #5: Brake and Tire Monitoring — Prevent Roadside Safety Events
The problem: Brake and tire failures are the leading cause of delivery vehicle accidents in the U.S. Urban delivery brakes wear at 3x highway rates; tire pressure loss from curb contact creates blowout risk invisible without systematic monitoring.
How Fleet Rabbit fixes it: Brake performance monitoring tracks deceleration rates over time — flagging increasing stopping distances before failure. TPMS integration alerts dispatchers to pressure loss before vehicles depart the depot.
Measured outcome: 45–55% reduction in brake-related roadside events and 60–70% reduction in tire blowout incidents. Combined, brake and tire monitoring prevents 1.2–1.8 roadside events per vehicle annually.
Way #6: Fleet-Wide Analytics — Fix Systematic Failure Patterns
Individual vehicle monitoring prevents individual breakdowns. Fleet-wide analytics identify the systematic patterns — specific vehicle models, routes, mileage thresholds — where breakdown risk concentrates, enabling proactive management that prevents entire failure categories.
Vehicle Model and Age Failure Pattern Identification
Fleet Rabbit surfaces breakdown frequency by make, model, age, and mileage — identifying whether the 2019 Ford Transits in your fleet fail at 3x the rate of 2021 equivalents, or whether vehicles above 85,000 miles generate 60% of breakdown events. Model-specific data enables replacement prioritization based on actual reliability, not depreciation schedules alone.
Maintenance
Cost Benchmarking
Per-Vehicle Maintenance Cost Benchmarking
Fleet Rabbit tracks total maintenance cost per vehicle per mile — creating fleet benchmarks that identify outlier vehicles consuming disproportionate resources. A vehicle running $0.28/mile versus a $0.14/mile fleet average is a data-driven replacement candidate. Annual benchmarking on a 50-vehicle fleet typically identifies 3–6 vehicles whose replacement pays back within 18–24 months in reduced maintenance spend.
The Combined Downtime Reduction: All 6 Mechanisms
35–42%
Unplanned Breakdown Reduction
60–75%
Battery No-Start Reduction
18–25%
Total Maintenance Cost Savings
95–100%
Service Interval Compliance
22–30%
Engine Failure Rate Reduction
60–90 days
Typical Full Platform ROI
Frequently Asked Questions
QHow quickly does predictive maintenance show measurable downtime reduction?
Fleet Rabbit begins generating fault alerts and battery health flags from day one. The first prevented breakdown often occurs within 30 days. Battery monitoring typically prevents the first no-start event within 2–4 weeks. Driver behavior coaching shows measurable brake wear improvement within 30–45 days. The complete 35% downtime reduction compounds over 60–90 days as fault code pattern data accumulates. Most fleets recover full platform subscription cost within the first prevented transmission or engine failure event.
QDoes Fleet Rabbit work with mixed fleets of different makes and models?
Fleet Rabbit supports mixed-fleet monitoring across Ford, GM, Ram, Mercedes Sprinter, and other delivery vehicle platforms — reading OBD-II and CAN bus data from any 2008 or newer vehicle. Fault code libraries are vehicle-make-specific, so a P0087 on a Ford Transit produces a different severity classification than the same code on a RAM ProMaster. Mixed-fleet analytics also identify performance differences between vehicle classes on equivalent duty cycles, informing future procurement decisions.
QWhat is the hardware installation process?
Fleet Rabbit's telematics hardware installs in 15–20 minutes per vehicle via the OBD-II diagnostic port — no electrical modifications, no professional installer required. For vehicles with refrigeration units or lift gates requiring separate monitoring, hardwired sensors take 45–60 minutes per vehicle by a standard auto electrician. Most 50-vehicle fleets complete full hardware deployment over a weekend, with monitoring data live in the Fleet Rabbit dashboard by Monday morning dispatch.
Related Fleet Rabbit Resources
The four AI capabilities transforming e-commerce fleet operations — real-time GPS visibility, predictive health monitoring, dynamic route optimization, and delivery analytics — with ROI data for each layer.
AI-driven fault prediction and automated maintenance scheduling that prevents mid-route breakdowns — the vehicle reliability foundation that route optimization depends on to function as planned.
How real-time utilization tracking, idle reduction analytics, and fleet right-sizing data reduce total fleet operating cost alongside breakdown prevention.
How GPS hardware, IoT vehicle data, and cloud analytics combine to deliver real-time visibility, predictive maintenance, and performance analytics — the technology infrastructure behind every capability in this guide.
Reduce Your Fleet Downtime 35% — See Fleet Rabbit's Predictive Maintenance in Action
Fleet Rabbit's predictive maintenance platform delivers all 6 downtime-reduction mechanisms through one integrated system — engine health monitoring, battery alerts, driver behavior scoring, automated service scheduling, and fleet analytics working simultaneously across your entire delivery operation. Most U.S. fleets recover full platform investment within 60–90 days through prevented breakdown events alone.
35–42% Fewer Breakdowns
18–25% Lower Maintenance Cost
Real-Time Fault Monitoring
Automated Service Scheduling
60–90 Day ROI
May 25, 2026
By Michael Finn
All Posts