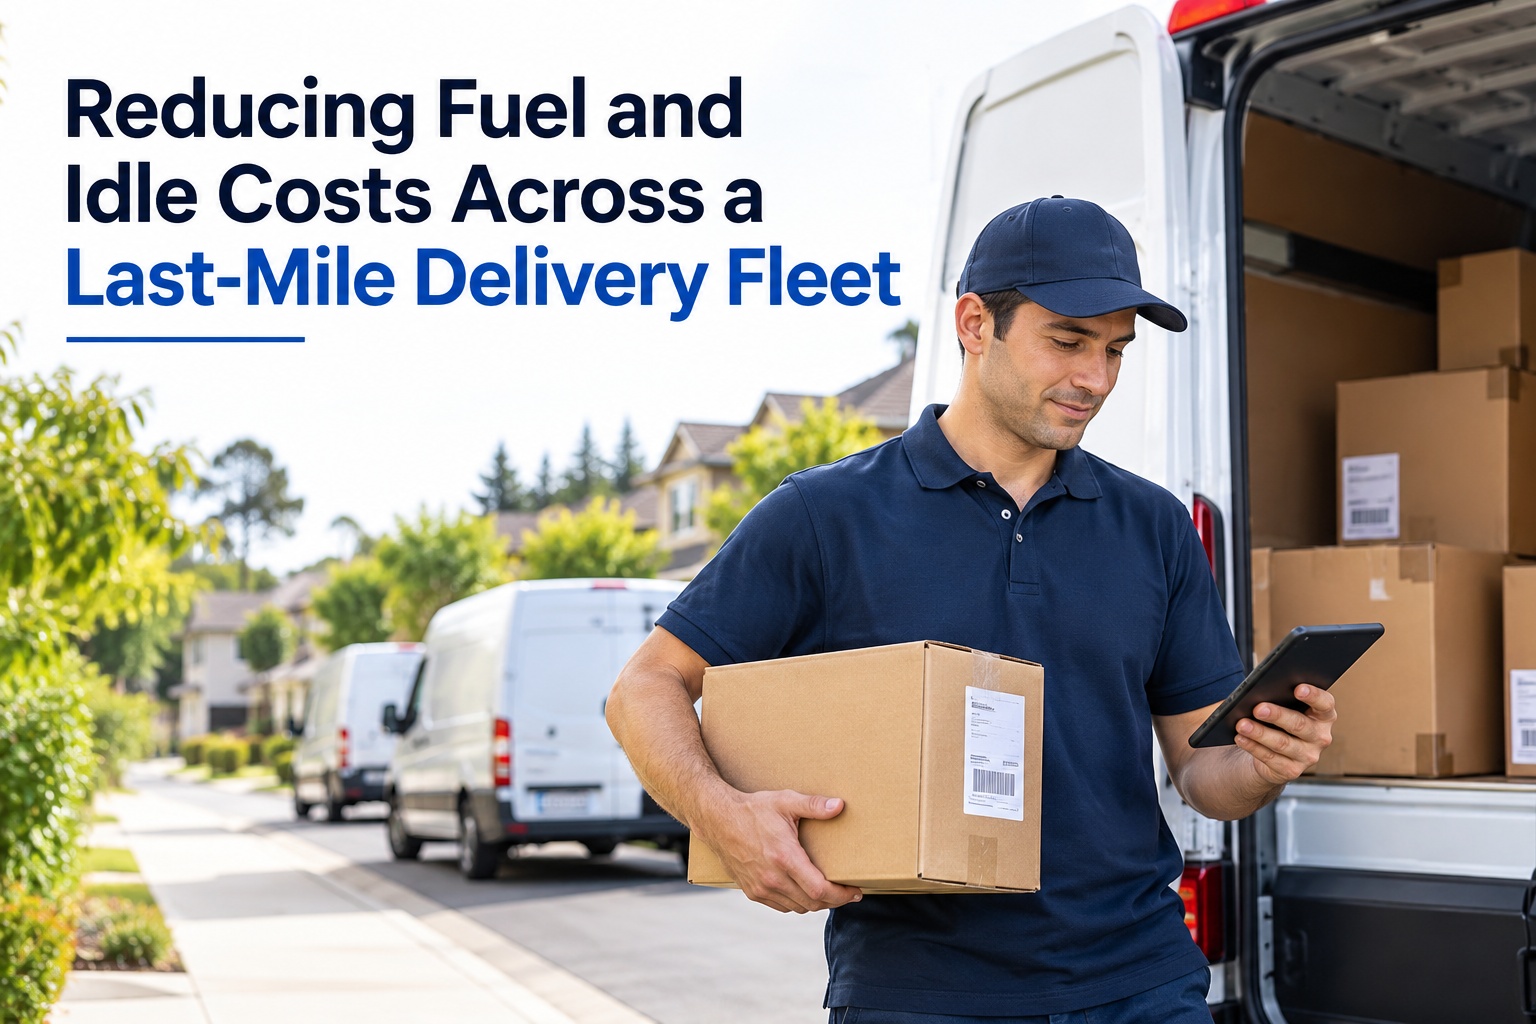
Every delivery van sitting at a curb with the engine running is burning fuel it will never recover in mileage, and every failed drop repeats a cost the fleet already paid once. Across last-mile operations, idle minutes and failed attempts rarely show up as their own line item on a report — they get absorbed into "fuel" and "labor" until someone pulls the numbers apart stop by stop. Book a demo to see where those minutes are hiding in your own routes.
Reducing Fuel and Idle Costs Across a Last-Mile Delivery Fleet
See cost per stop, idle minutes, and failed-attempt overhead on one dashboard — broken down by route, driver, and vehicle, not buried in a fleet-wide average.
~0.8 gal/hr
Typical idle burn rate for a delivery-class truck, based on DOE fuel-at-idle data — before AC or a lift gate draws more.
10–25%
Share of last-mile operating cost that fuel typically represents, across recent industry cost breakdowns.
2x cost, 0 revenue
What a failed delivery attempt does to a stop's economics — the same fuel and labor spent again, nothing delivered.
Where the Money Actually Leaks on a Route
None of these show up as a separate charge. They just quietly widen the gap between planned cost and actual cost.
Curb-side idling
Waiting at a locked gate, a buzzer with no answer, or a customer who isn't home keeps the engine running long after the stop should have closed.
Repeat attempts
A failed delivery doesn't cancel the first attempt's fuel and labor — it adds a second trip on top of it, for the same one package.
Auxiliary loads
Reefer units, lift gates, and cabin air conditioning keep drawing fuel even while the vehicle itself isn't moving an inch.
Unlogged detours
Out-of-route miles to dodge a closure or hunt for parking rarely make it into a route report, even though they burn real fuel.
What Idle Minutes Turn Into Once You Multiply by a Fleet
One vehicle idling a little longer than it should looks trivial. Scaled across a fleet and a year, it isn't. Here's an illustrative example — swap in your own vehicle count and idle minutes to see your own number.
Per vehicle
0.8 gal / idle hour
45 extra idle min / day
≈ 0.6 gal / vehicle / day
Across 25 vehicles
≈ 15 gal / day fleet-wide
Over a 250-day year
≈ 3,750 gal / year
At $3.75 a gallon, that's roughly $14,000 a year spent on minutes nobody planned for — from a fleet that isn't unusually large or unusually inefficient.
What a Failed Delivery Really Costs
A redelivery attempt burns the same fuel and the same driver time as the first attempt, without adding a single dollar of revenue. That much is consistent across the industry. The exact dollar figure is where it gets murky — several commonly quoted numbers in the fifteen-to-twenty-dollar range trace back to software vendors rather than independently audited research, and the real cost depends heavily on route density, driver wage, and average stop length.
The more reliable approach is building that number from a fleet's own inputs rather than borrowing someone else's average. Agencies that sign up can see failure rate, reason, and repeat-attempt cost by route instead of a single blended guess.
Put idle minutes and failed attempts on the record
Cost per stop, idle time, and delivery outcomes — tracked by route, driver, and vehicle, not averaged away.
How Visibility Closes the Gap
Fuel and idle costs stop being a mystery once they're tied to the stop and driver that generated them.
Idle alerts
Flags a vehicle idling past a set threshold, tagged to the exact stop it's parked at — not just a daily engine-hours total.
Cost-per-stop view
Rolls fuel, time, and labor into a per-stop number instead of a single fleet-wide average that hides the worst routes.
Failed-attempt reason codes
Captures why a stop failed — no access, no one home, refused — instead of leaving a blank "undelivered" entry.
Route replay
Reconstructs exactly where a route lost time, so the pattern is visible instead of relying on a driver's memory.
Frequently Asked Questions
How much fuel does a delivery van burn just sitting still?
Roughly 0.8 gallons an hour for a delivery-class truck at idle, based on U.S. Department of Energy fuel-at-idle data. Running air conditioning or a lift gate pushes that figure higher.
Is there a reliable industry number for what a failed delivery costs?
Not an independently audited one. Figures in the fifteen-to-twenty-dollar range circulate widely, but they generally originate from delivery software vendors rather than neutral research. Building the number from a fleet's own labor and mileage costs is more reliable than borrowing an average.
How much of a last-mile delivery's cost is fuel?
Commonly cited in the 10% to 25% range of total operating cost, with maintenance and route-optimization technology adding further percentages on top.
Can idle time be tracked automatically instead of estimated?
Yes. Telematics-based idle detection can tie idle minutes to the specific stop a vehicle is parked at, rather than reporting a single engine-hours number for the whole day.
How fast can a fleet start seeing this data?
Most fleets are looking at route-level idle and cost data within a day of choosing to sign up, since existing vehicle and route data import directly.
What should a fleet bring to a first walkthrough?
A current vehicle list and a sample week of route data are enough. Book a demo and see it configured against real routes.
See idle time and cost per stop across your own routes
Stop guessing where the fuel budget is going. Get it broken down by route, driver, and vehicle.







