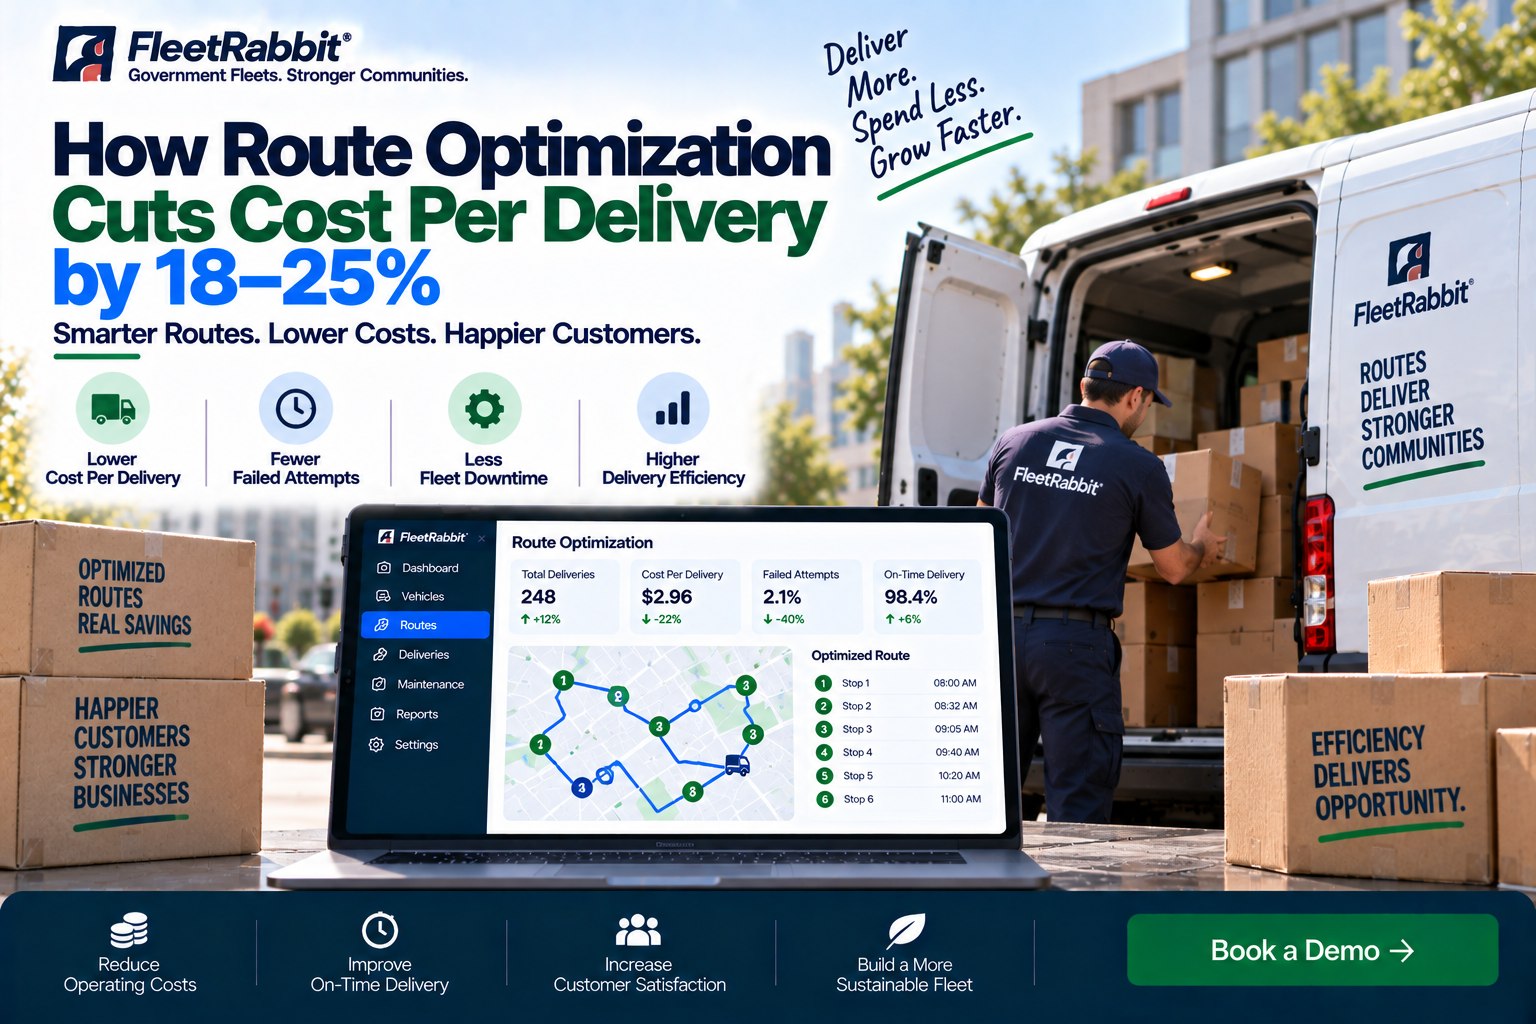
High-volume last-mile delivery carriers, parcel networks, and regional 3PLs operate against razor-thin margins: absorbing excessive stem mileage, paying unbudgeted driver overtime, managing vehicle wear on stop-and-go city streets, and absorbing the cost of failed delivery attempts. When route planning relies on static legacy software or manual dispatch sheets, cost per delivery (CPD) balloons past $5.50 to $8.00 per stop. FleetRabbit delivers intelligent route optimization and unit-cost reduction software engineered specifically for e-commerce delivery fleets. Uniting multi-variable stop density solvers, dynamic traffic re-routing, vehicle payload balancing, and preventative maintenance telematics, FleetRabbit systematically drives cost per delivery down by 18% to 25% within weeks. Eliminate wasted route miles, reduce fleet maintenance expenses, and track cost telemetry completely offline in multi-level parking decks and rural dead zones. Book a demo to see how FleetRabbit cuts your fleet's cost per delivery.
SECTION: FINANCIAL TELEMETRY COMMAND TOWER HEROHow Route Optimization Cuts Cost Per Delivery by 18–25%
Reduce cost per drop from $6.80 to under $4.90. Maximize package density, eliminate secondary re-deliveries, cut fuel burn by 22%, and align route intensity with predictive vehicle maintenance.
The Mathematical Levers Driving 18–25% CPD Reductions
FleetRabbit compresses delivery expenses by orchestrating four interrelated operational cost centers simultaneously.
Density Clustering
Clusters stops by micro-territories rather than postcodes, shrinking inter-stop driving distances and multiplying drops per paid driver hour.
Dynamic Pacing
Continuous algorithmic re-sequencing prevents afternoon traffic choke points, returning delivery drivers to the depot within standard shift hours.
ETA Accuracy
Rolling recipient SMS links ensure customers are present for signature-required drops, eliminating the $12–$15 cost of secondary redeliveries.
Asset Wear Alignment
Smooth route distribution eliminates aggressive highway backtracking, reducing foundation brake heat and prolonging tire tread life.
Why Legacy Delivery Routing Bleeds Last-Mile Profits
Without integrated optimization, carriers bleed margin across four hidden expense leaks that flat-rate billing cannot sustain.
Deadhead Mileage & Fuel Inefficiency
Unoptimized vehicle manifests send drivers crisscrossing city blocks to meet delivery windows. Excessive left turns and traffic idling burn 20% to 30% more fuel than clustered routing algorithms, inflating fuel surcharges.
Unbudgeted Afternoon Overtime Creep
When route schedules fail to account for building dwell times and traffic bottlenecks, an 8-hour shift stretches into 10 hours. Paying time-and-a-half to finish the final 20 parcels destroys profit margins on the entire truckload.
The Compounding Penalty of Failed First Drops
A package not delivered on attempt one requires van space the next morning, redundant sorting labor at the cross-dock, and repeat fuel burn. Carrying the same parcel twice cuts net delivery margins to zero.
Premature Vehicle Wear from Erratic Routing
Unbalanced stop-and-go driving with overloaded axles accelerates brake pad wear, heats wheel hub bearings, and prematurely destroys tires, resulting in unbudgeted emergency fleet repair invoices.
Built to Systematically Squeeze Waste from Delivery Routes
FleetRabbit connects algorithmic density matching, vehicle health telematics, live traffic solvers, and mobile proof-of-delivery into one platform. Request a 1-on-1 walkthrough.
Multi-Stop Clustering Solver
Compress spatial spread between delivery drops; package-to-distance algorithms ensure couriers deliver more units within fewer physical road miles.
Building Dwell-Time Profiling
Account for elevator waits, commercial loading dock security, and apartment stair climbs automatically, generating achievable routes that prevent driver overtime.
Live Midday Traffic Re-Sequencing
Detect highway bottlenecks and urban congestion in real time; the system automatically re-orders remaining stops to protect appointment windows without mileage bloat.
Basement Dock Offline Syncing
Couriers execute stop sequences, scan barcodes, and capture digital proof-of-delivery inside subterranean parking docks with zero cellular coverage; records auto-sync upon departure.
Route-Tied Vehicle Health Telematics
Correlate route severity, payload weight, and stop counts against brake wear and tire lifecycle PM schedules, preventing costly roadside breakdowns mid-shift.
Live Cost-Per-Delivery Analytics
Track real-time CPD metrics across every driver, vehicle type, and delivery zone, identifying unprofitable territories and optimizing fleet billing models.
Cost Compression Without Compromising Roadway Compliance
FleetRabbit’s route optimization algorithms operate strictly within federal motor carrier safety standards, labor guidelines, and equipment regulations.
Integrates mandatory rest break schedules, maximum 11-hour driving windows, and shift limits directly into cost-optimized dispatch manifests to eliminate fatigue violations.
Standardizes driver pre-trip/post-trip eDVIR walkarounds, steering linkage audits, brake pushrod stroke verifications, and certified annual mechanical roadworthiness files.
Calculates real-time payload distribution across steer and drive axles against chassis Gross Axle Weight Ratings (GAWR), preventing roadside scale fines and suspension damage.
Maintains verified digital shift records, actual driving time stamps, and automated route equalization logs to substantiate payroll compliance and defend against wage claims.
Route Optimization Software & CPD Benchmark Comparison
A feature-level comparison focused on unit-cost reduction, dynamic re-routing, and maintenance integration as of 2026. Request a technical comparison.
| Capability | FleetRabbit | Generic Route CAD | Basic GPS Trackers | Static Spreadsheets |
|---|---|---|---|---|
| Pricing (per asset/month) | $5/month | $25–$60/month | $15–$35/month | High overtime costs |
| Cost-Per-Delivery Reduction | 18%–25% verified | 4%–8% marginal | 0% (tracking only) | 0% (cost inflation) |
| Integrated Fleet PM Scheduling | Native telematics & eDVIR | Requires separate tool | Not supported | Unenforced paper tags |
| Midday Real-Time Re-Sequencing | Continuous traffic solver | Manual re-dispatch | Not supported | Static printed paper |
| Subterranean Dock Offline Mode | Full store-and-forward | Network dependent | Data dropped | Paper only |
| Free Trial Access | 14 days, up to 3 assets | Sales demo only | Demo only | None |
| Contract Terms | Monthly or annual | Multi-year lock-in | 3-year minimum | None |
5-Step Cost Compression Implementation Pathway
FleetRabbit deploys cleanly into your e-commerce dispatch hubs, WMS streams, and driver smartphones in under two weeks without service disruption.
Historical Route & Cost Audit Ingestion
Import previous delivery manifests, payroll overtime expenses, fuel receipts, and vehicle maintenance records to establish an accurate baseline Cost Per Delivery.
Density & Time-Window Configuration
Configure regional delivery territories, customer appointment windows, vehicle cubic payload capacities, and building dwell-time parameters.
Fleet Maintenance & eDVIR Integration
Set up pre-trip inspection walkarounds and bind route mileage accumulation to automated brake, tire, and fluid service thresholds.
Drivers Mobile Application Rollout
Equip last-mile delivery couriers with the offline-first mobile app on standard smartphones for turn-by-turn routing, barcode scanning, and proof-of-delivery.
Live CPD Command Dashboard Go-Live
Activate real-time route optimization, dynamic midday re-sequencing, and 1-click unit-cost reduction reporting across central logistics control desks.
2-Week Deployment Plan & Milestones
Transform your delivery fleet's unit economics and cut operating overhead with zero disruption to scheduled distribution shifts. Request an onboarding plan.
Week 1: Cost Baseline & Setup
- Sync WMS parcel order streams, customer delivery tiers, and driver shift rosters
- Configure vehicle volumetric profiles, payload ratings, and territory boundaries
- Set up pre-trip driver eDVIR checklists and vehicle maintenance scheduling
- Assign user access roles for Operations Directors, Dispatchers, and Couriers
Week 2: Field Testing & Route Launch
- Distribute mobile app to drivers and conduct 15-minute training on dynamic routing
- Validate store-and-forward offline syncing inside concrete basement loading docks
- Simulate midday order additions and traffic delays to verify dynamic re-sequencing
- Launch live cost-per-delivery tracking dashboard and automated fuel savings reports
Compress Your Fleet's Cost Per Delivery by 18%–25% in Less Than 30 Days
Maximize stop density, eliminate driver overtime, and align route intensity with preventative fleet maintenance. Start today at $5/asset/month with a 14-day free trial.
Real-World Cost-Per-Delivery Reductions
Documented unit-cost improvements reported by regional parcel carriers and e-commerce logistics fleets. Request the full logistics case study.
23.4% Reduction in Cost Per Delivery Across 65 Vans
A regional parcel carrier operating 65 delivery vans faced severe margin compression with an average CPD of $6.94 driven by excessive deadhead mileage and driver overtime. FleetRabbit implemented multi-stop density clustering and dynamic midday re-routing, driving CPD down to $5.31 and generating $168,000 in net annual savings.
$1.42 Saved Per Drop & 38% Overtime Cut
A fast-growing e-commerce fulfillment carrier struggled with high driver turnover and unbudgeted evening overtime. FleetRabbit introduced building dwell-time profiling and recipient SMS notifications, cutting cost per delivery from $6.48 to $5.06 while reducing driver overtime hours by 38%.
When you run tens of thousands of parcel drops every week, twenty cents off your cost per delivery is the difference between surviving and dominating your regional market. Before FleetRabbit, our dispatchers were using routing software that had no concept of driver overtime costs, building dwell delays, or vehicle maintenance wear. We were burning fuel crisscrossing towns and paying thousands in unbudgeted overtime every Friday. FleetRabbit completely transformed our unit economics. It packed our routes tighter, stopped our drivers from hitting midday traffic choke points, and reduced our overall cost per delivery by over twenty-two percent in the first sixty days. It paid for itself in the first week.
Frequently Asked Questions
Start Cutting Your Fleet's Cost Per Delivery in Less Than 2 Weeks
Compress route mileage, eliminate unbudgeted overtime, and achieve 99%+ first-pass delivery success at $5/asset/month with a 14-day free trial.







