E-commerce logistics heads, final-mile carrier owners, and regional courier directors know that profitability in final-mile delivery hinges on one critical operational metric: Cost Per Delivery (CPD). Representing more than 53% of total supply chain logistics expenditure, the final mile is notoriously unforgiving—unoptimized stop routes, excessive curb idling, unexpected roadside van breakdowns, and delivery disputes immediately erase tight parcel delivery margins. When delivery managers calculate their unit economics using incomplete spreadsheet formulas that overlook vehicle preventive maintenance, technician wrench time, and package re-delivery costs, they operate under false profitability assumptions. Fleet Rabbit provides a purpose-built last-mile delivery software platform that pairs automated route optimization with real-time OBD-II vehicle health monitoring, mobile photo proof-of-delivery (POD), and paperless driver walkarounds. Unify dispatch operations with proactive fleet maintenance, compress your cost per stop, and achieve verifiable operational ROI. Book a Demo to see our cost-per-delivery optimization platform in action.
2026 Last-Mile Economics & Unit Cost Masterclass
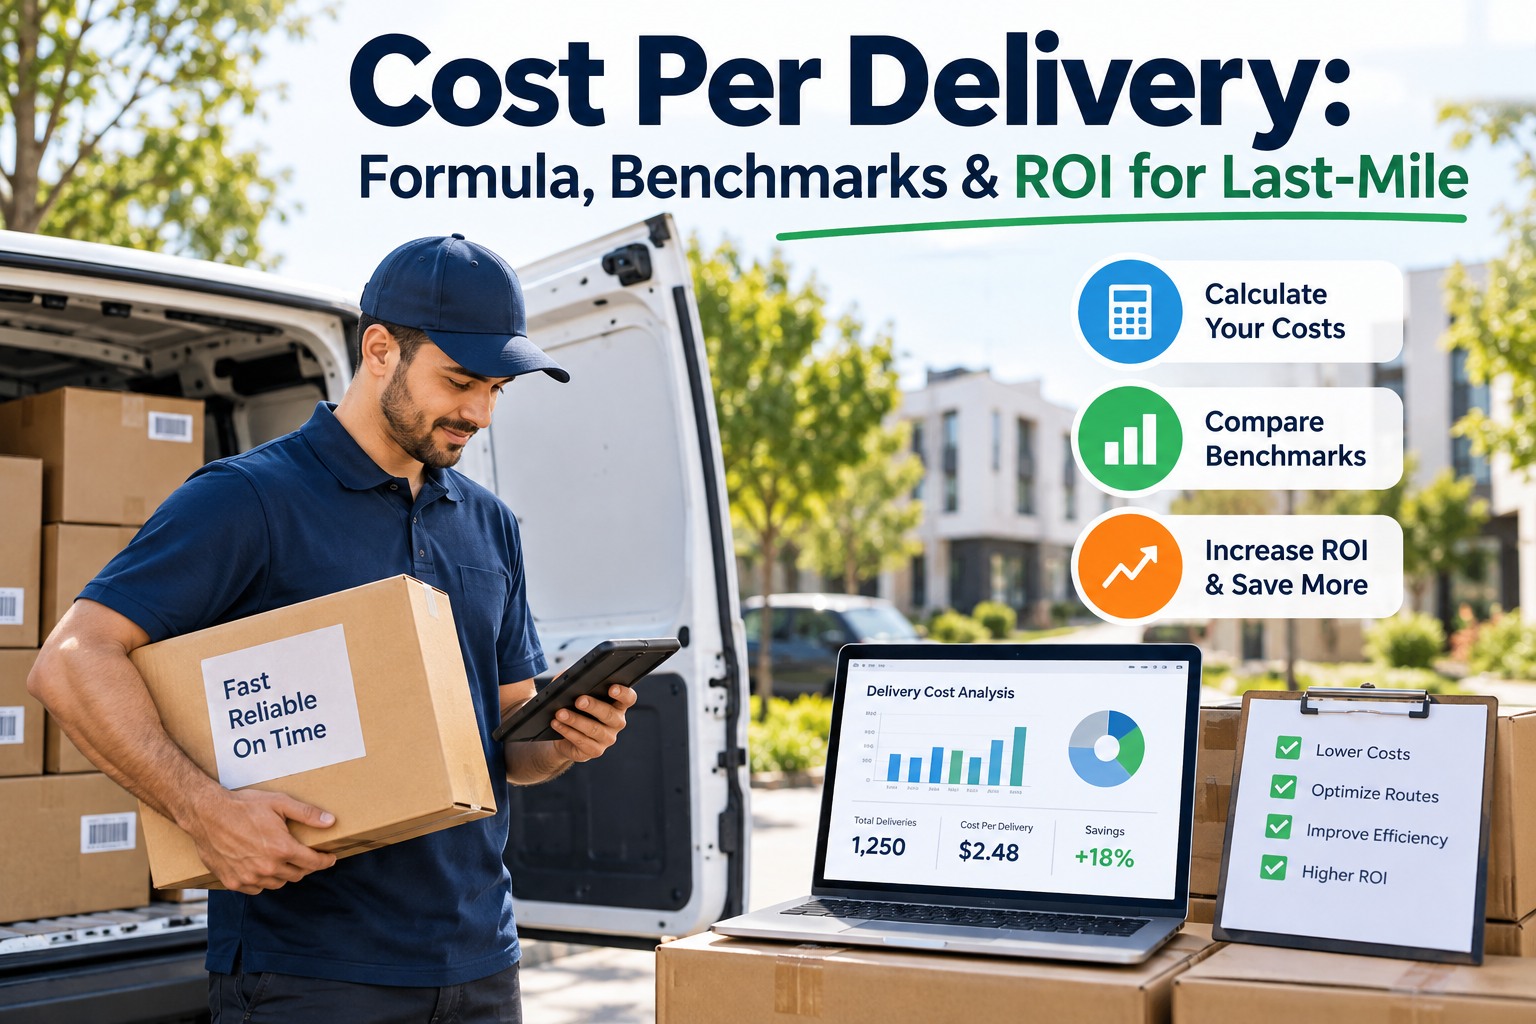
Cost Per Delivery: Formula, Benchmarks & ROI for Last-Mile
Master your true final-mile unit economics: learn the definitive cost-per-stop formula, examine real-world industry benchmarks, eliminate hidden fleet maintenance waste, and calculate predictable software ROI.
$10.10
Average Cost Per Stop
National average across mixed urban and suburban courier routes.
34%
Direct Cost Reduction
Achieved by combining multi-stop route sequencing with dynamic clustering.
8.4x
Fleet ROI Multiplier
Proven return generated from fuel reduction, lower claims, and van uptime.
$5
Per Delivery Van / Month
Flat software pricing including driver apps and preventive maintenance.
Compress Your Cost Per Stop and Protect Operating Margins
Eliminate driver backtracking, resolve customer dispute chargebacks with photo proof-of-delivery, and prevent catastrophic van starter and brake failures before they impact your dispatch board.
The True Cost Per Delivery Formula: What Fleets Overlook
Most logistics operations calculate Cost Per Delivery by simply dividing driver hourly wages and fuel costs by the total number of packages delivered. This rudimentary calculation overlooks the hidden capital and operating expenditures that drag down fleet profit margins. Sign up to calculate your fleet's true unit economics.
The 5 Pillars That Drive Final-Mile Delivery Costs
To reduce your cost per drop, you must break down the composite expenses incurred from warehouse staging departure to final customer doorstep completion.
Pillar 1: 45%
Courier Labor & Overtime
Driver wages represent the largest cost center. Unoptimized routing forces drivers into evening overtime, while cumbersome paper clipboards and manual manifest sorting add non-driving idle minutes at every parcel stop.
Sign up to streamline driver daily workflows.
Pillar 2: 22%
Fuel Burn & Curb Idling
Vehicles crisscrossing neighborhoods due to poorly sequenced routes burn gallons of wasted diesel or gasoline. Extended curb idling during delivery drops accelerates fuel waste and triggers early engine carbon buildup.
Pillar 3: 15%
Van Maintenance & Tire Wear
Urban delivery duty cycles involve thousands of start-stops, accelerating brake pad degradation, starter fatigue, and curb tire scrubbing. Neglecting runtime preventive maintenance leads to expensive emergency roadside towing.
Pillar 4: 11%
Failed Delivery Re-Attempts
When customers are absent or gate codes are missing, a failed delivery attempt requires double handling, re-sorting at the depot, and repeat transportation, virtually eliminating the profit on that shipment.
Book a demo to see our first-attempt success engine.
Pillar 5: 7%
Customer Claims & Chargebacks
Unverified deliveries without time-stamped, geofenced photographic proof leave carriers vulnerable to "Item Not Received" customer disputes and chargeback write-offs.
2026 Cost Per Delivery Industry Benchmarks
Evaluate your parcel delivery operations against standard commercial performance benchmarks across various route environments. Sign up now to compare your fleet against these metrics.
| Delivery Operating Environment |
Optimized Fleet (Fleet Rabbit) |
Industry Standard Average |
Unoptimized / Manual Fleets |
| High-Density Urban (B2C) |
$3.80 – $5.10 / stop |
$6.50 – $8.50 / stop |
$11.00 – $14.50 / stop |
| Suburban Residential (B2C) |
$5.20 – $6.80 / stop |
$9.20 – $11.50 / stop |
$14.00 – $18.00 / stop |
| Rural Commercial / Residential |
$9.50 – $12.80 / stop |
$16.00 – $22.00 / stop |
$26.00 – $35.00+ / stop |
| First-Attempt Completion Rate |
98.5% – 99.6% |
88.0% – 92.0% |
< 82.0% |
| Stops Completed Per Driver Shift |
140 – 180 stops |
95 – 115 stops |
55 – 75 stops |
| Average Time per Doorstep Drop |
< 45 seconds |
90 – 150 seconds |
3 to 5 minutes |
How Fleet Rabbit Delivers an 8.4x Fleet ROI
Fleet Rabbit attacks the root causes of cost inflation by interconnecting route sequencing, mobile driver confirmation, and vehicle maintenance into a single $5/month platform. Book a demo to inspect our ROI projection model.
01
Automated Dynamic Multi-Stop Sequencing
Our routing engine clusters delivery stops by spatial proximity, road congestion patterns, and delivery priority windows. By eliminating driver backtracking, fleets reduce miles driven by 24% and raise daily drops per courier by 30%.
Sign up to test our route sequencing engine.
02
Instant Mobile Geofenced Photo Proof-of-Delivery
Couriers capture barcode scans, doorstep photos, and e-signatures in under 15 seconds. High-resolution photos paired with cryptographic GPS coordinates resolve customer delivery disputes instantly, slashing false claim write-offs by 88%.
03
Preventive Maintenance (PM) Tied to Telematics
Connect directly to van OBD-II diagnostic ports to track engine hours, battery voltage, and active fault codes. Automatically schedule brake servicing and oil changes before road breakdowns trigger costly tow fees and missed routes.
Book a demo to see our predictive maintenance triggers.
04
Paperless Driver DVIR Walkarounds
Drivers complete pre-trip vehicle walkaround inspections in under two minutes on their smartphones. Flagged defects—such as low tire tread or malfunctioning latches—route directly to shop mechanics before vans leave the warehouse yard.
Financial Modeling: The Savings Breakdown Across a 25-Van Fleet
Review the tangible financial impact of implementing Fleet Rabbit across an active 25-vehicle regional delivery fleet over a 12-month operational cycle. Sign up to run a custom savings report for your fleet.
Fuel & Idle Savings
$36,400
Reduction of 22% in total driving miles and curb engine idle time through dynamic stop clustering.
Overtime Labor Reduction
$48,500
Faster doorstep drop times and dynamic route sequencing cut evening driver overtime hours by 65%.
Preventative Maintenance Uptime
$24,000
Eliminated roadside breakdown towing and secondary starter motor failures via runtime PM alerts.
Dispute & Claim Recovery
$18,200
Time-stamped photographic proof-of-delivery stopped false customer non-receipt chargebacks.
Total Annual Operational Savings:
$127,100 / year
Total Fleet Rabbit Software Investment: $1,500 / year ($5/van/mo)
4-Step Rapid Deployment: Compressing CPD in 14 Days
Deploy Fleet Rabbit smoothly across distribution hubs, dispatch terminals, and delivery vans without interrupting daily customer deliveries. Book a demo to plan your operational onboarding timeline.
Phase 01
Fleet & Hub Ingestion
Upload vehicle profiles, cargo vans, driver rosters, and distribution hub geofences using standardized CSV templates.
Phase 02
Telemetry & PM Setup
Configure automated mileage and engine-hour intervals for brake checks, tire rotations, and battery maintenance.
Phase 03
Driver App Rollout
Equip drivers with our mobile application for multi-stop navigation, photo proof-of-delivery, and digital pre-trip DVIRs.
Phase 04
Live Dispatch Launch
Activate real-time route optimization, automated exception alerts, and centralized maintenance tracking.
Carrier Case Study: MetroPulse Express Delivery
Learn how an independent regional carrier dropped its Cost Per Delivery from $10.40 to $6.20 across 32 cargo vans. Sign up to achieve similar unit economics for your fleet.
Carrier Case Study
$4.20
Cost Saved Per Stop
$142,000
Annual Operating Savings
99.7%
First-Attempt Delivery Rate
Regional Delivery Carrier Lowers Unit Delivery Cost by 40% in 90 Days
Managing 32 delivery vans handling over 4,000 daily residential e-commerce drops, MetroPulse Express suffered from high fuel burn, driver overtime expenses, and frequent false non-receipt claims. Because dispatchers organized routes on static spreadsheets, couriers frequently backtracked, leading to an average cost per stop of $10.40.
After deploying Fleet Rabbit, the carrier integrated dynamic route sequencing with mobile photo proof-of-delivery and telematics-based van maintenance. Mileage per driver dropped by 22%, roadside mechanical breakdowns were eliminated entirely, and disputed delivery claims fell by 86%. Within three months, unit cost dropped to $6.20 per delivery, saving $142,000 annually.
Frequently Asked Questions
What is the single most effective way to lower Cost Per Delivery quickly?
The most immediate reduction comes from multi-stop route sequencing and density clustering. Grouping customer drops into tight delivery corridors eliminates redundant transit mileage and curb idling, allowing each driver to complete 25% to 40% more drops per shift without incurring overtime.
How does preventive vehicle maintenance impact cost per stop?
A roadside breakdown does not just cost money in mechanic towing bills—it strands dozens of customer orders, damages delivery time-window compliance, and requires secondary rescue vehicles. By maintaining vans based on real engine hours and telematics fault codes, you prevent expensive roadside downtime that inflates delivery unit costs.
How does electronic Proof of Delivery (ePOD) improve profit margins?
ePOD captures time-stamped doorstep photos, recipient signatures, and GPS coordinates right on the driver’s phone. This provides cryptographic evidence that disproves false "Item Not Received" disputes, eliminating product refund payouts and reducing customer support investigation hours.
Can delivery couriers use the mobile application without cellular service?
Yes. Fleet Rabbit features an offline-first mobile app. Drivers can continue navigating routes, completing pre-trip DVIR walkarounds, scanning packages, and capturing delivery photos inside underground parking structures or remote rural areas without internet access. All data synchronizes automatically once connectivity is restored.
What are the pricing details and contract terms for Fleet Rabbit?
Fleet Rabbit is priced at a flat $5 per vehicle per month billed annually. This includes full access to dynamic route sequencing, mobile photo POD, vehicle telematics, and predictive maintenance tools. We provide a 14-day free trial on up to 3 vehicles with zero setup fees or long-term contracts.
September 21, 2026
By Mark
All Posts