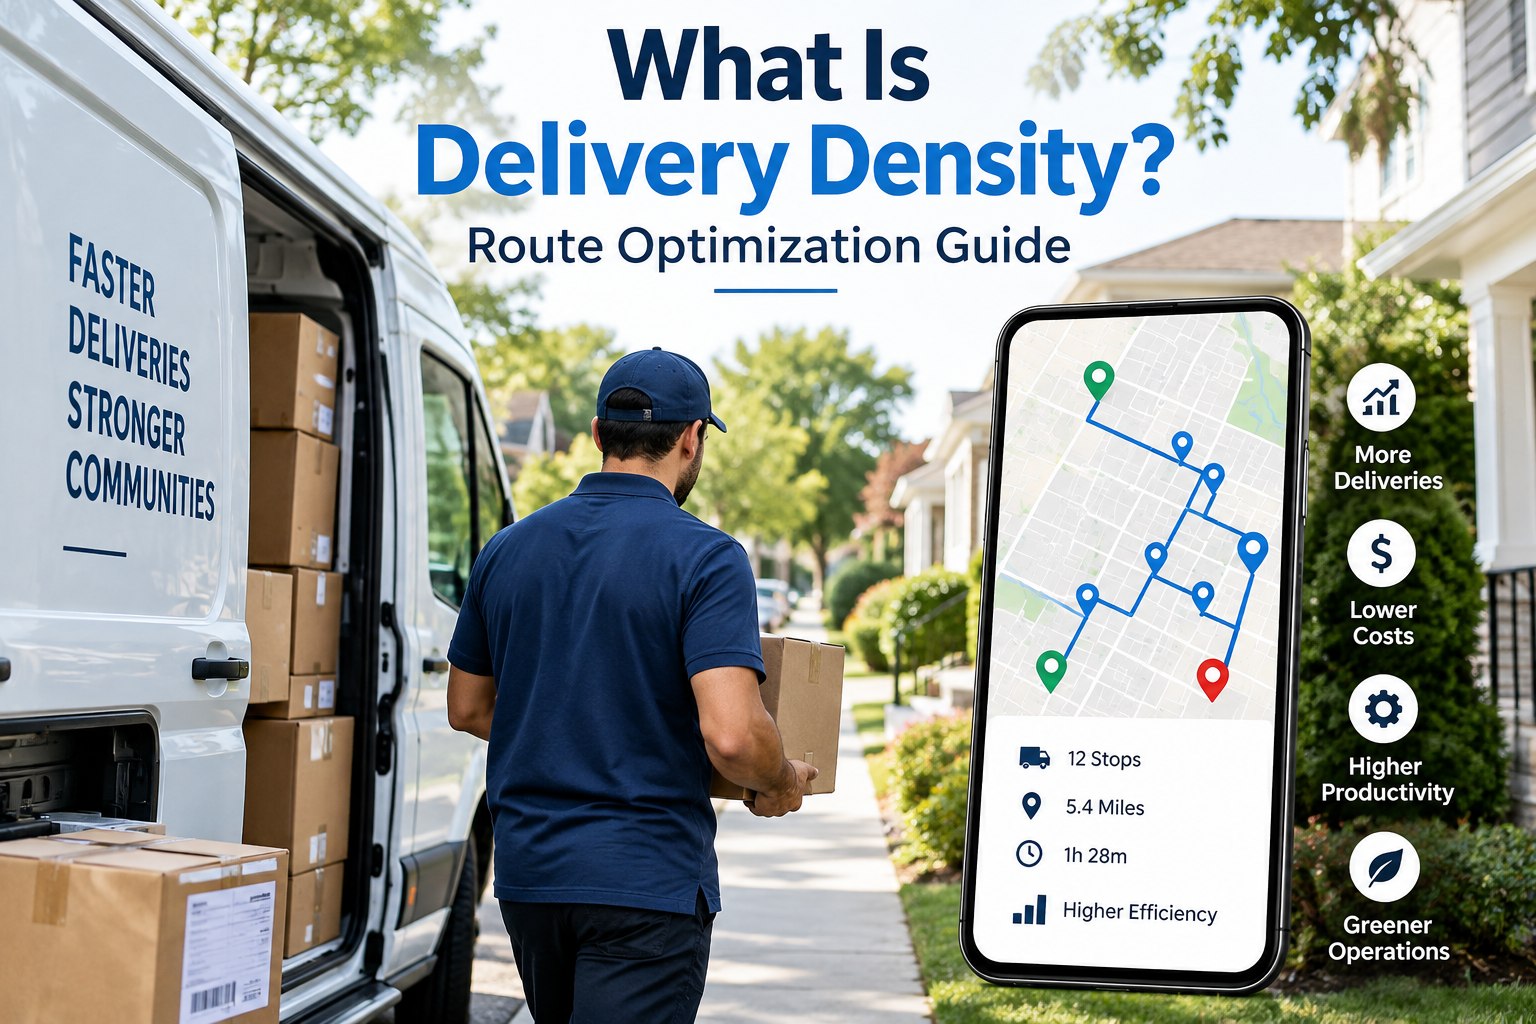
In high-velocity e-commerce logistics, final-mile distribution, and regional courier operations, delivery density represents the single most decisive metric determining route profitability, driver velocity, and operational scalability. Often referred to interchangeably as stop density, delivery density measures the concentration of completed deliveries executed within a specified geographic boundary or operational time window. When delivery density is low, commercial vans burn excess fuel traversing sprawling residential deadheads, drivers spend more time navigating highway traffic than completing doorstep handoffs, and the overall cost per delivery escalates dramatically. Conversely, compounding delivery density collapses the physical distance and transit time between consecutive stops, maximizing driver earning power and dramatically decreasing unit-level freight costs. Modern logistics leaders achieve high density not by chance, but by coordinating territory zoning, dynamic route clustering, order-cutoff scheduling, and automated dispatch workflows. To evaluate how our platform compresses delivery corridors and drives down cost-per-stop, book a technical demonstration with our logistics engineering team or launch your dispatch territory optimization immediately via our free platform sign up.
What Is Delivery Density? Route Optimization Guide
An in-depth mathematical, operational, and architectural guide to calculating delivery density, collapsing last-mile deadhead miles, clustering drop-offs, and scaling high-velocity parcel fulfillment.
Sprawling Suburban / Rural Route
Clustered Urban / Compact Route
Maximize Your Territory Density and Slash Last-Mile Operating Costs
Empower your dispatchers with intelligent geographic clustering, dynamic delivery window grouping, and automated street-level route sequencing starting from $3/vehicle/month with no hardware lock-in.
The Mathematical Architecture of Delivery Density: Formulas & Variables
To optimize delivery density, fleet managers must measure it using clear operational formulas rather than relying on qualitative impressions. Delivery density expresses the relationship between completed customer drop-offs and the operational resources (distance, physical space, or shift hours) consumed to execute them. In professional last-mile logistics, delivery density is primarily tracked through three distinct formulas: Linear Stop Density, Area Density, and Temporal Stop Density. Review your delivery territories against these mathematical models by booking an interactive density benchmarking demo or test automated route clustering directly through our quick platform sign up.
Linear Stop Density (Stops per Mile/KM)
Calculates the number of stops completed per mile driven across the entire shift duration, including stem time from the depot to the first stop.
Temporal Stop Density (Stops per On-Road Hour)
Measures how many drops a driver executes per hour on the road, factoring in driving transit, curbside parking, and doorstep walking dwell time.
Spatial Area Density (Stops per Square Mile/KM)
Measures the geographic concentration of customer order destinations inside a designated delivery zone or postal code polygon.
Operational Comparison: Low Density Spread vs. FleetRabbit Optimized Clustering
Running multi-stop delivery routes without intelligent order clustering forces drivers into circuitous loops, zig-zagging across wide geographic zones while accumulating extensive deadhead miles. Discover how transitioning to an automated, density-focused delivery engine transforms last-mile performance across essential commercial metrics. Logistics directors can evaluate territory clustering algorithms by scheduling a tailored dispatch optimization demo or import customer delivery manifests via our self-service sign up.
| Operational Performance Factor | Unclustered / Static Spread Routes | FleetRabbit Density-Optimized Clustering | Fleet & Business Advantage |
|---|---|---|---|
| Inter-Stop Driving Distance | 1.8 to 3.5 miles between consecutive stops | Under 0.25 miles (often same block / building) | Cuts transit deadhead miles by up to 72% |
| Average Hourly Stop Velocity | 6 to 9 stops per driver hour | 18 to 26 stops per driver hour | Multiplies courier capacity by nearly 3x |
| Direct Labor Cost per Drop | $3.50 to $5.20 per completed parcel | $1.20 to $1.65 per completed parcel | Saves over $350 per driver route every day |
| Vehicle Fuel & Battery Drain | Excessive idling and high highway miles | Low localized mileage and compact zones | Extends EV van battery range by 45+ miles |
| Customer Delivery Window Accuracy | Frequent misses due to unpredictable transit | 99.2% window compliance via tight corridors | Protects shipper contracts and carrier tier bonuses |
4 Strategies to Artificially Engineer High Delivery Density
Logistics operators do not have to wait passively for organic consumer demand to generate dense routes. Sophisticated delivery enterprises actively engineer high stop density through smart commercial policies, customer communication, and technological zoning.
Dynamic Geographic Territory Zoning
Divide urban delivery territories into dynamic, polygon-based micro-zones. Rather than allowing drivers to roam freely across a whole metropolitan area, dispatch algorithms restrict vehicle manifests to compact residential clusters or specific commercial commercial corridors.
Scheduled Delivery Days & Order Batching
Encourage regional customers to select designated delivery days (e.g., Tuesday/Thursday neighborhood drops). Batching non-urgent orders into designated delivery waves doubles the stops per street while keeping total vehicle miles flat.
Micro-Hub & PUDO Locker Staging
Consolidate deliveries into high-density pick-up/drop-off (PUDO) parcel lockers, apartment mail rooms, or neighborhood retail collection points. Dropping 30 packages at a single locker bank achieves an instantaneous temporal density of 60+ packages per hour.
Incentivized Green Delivery Windows
Provide e-commerce consumers with "Eco-Friendly" delivery slot incentives during checkout if a delivery van is already scheduled to visit their specific street or apartment complex, organically compressing delivery distances without operational friction.
Financial Capital Stewardship: Where Low Delivery Density Drains Profit
Operating a delivery fleet with dispersed, low-density routes creates compounding operational leaks across vehicle wear, driver overtime, and excessive fuel burn. Analyzing these systemic cost drivers helps logistics directors and business owners defend route optimization investments before executive boards. Measure your delivery network's exact cost recovery by booking a personalized cost assessment demo or get started directly via our rapid platform sign up.
Top Operational Budget Drains Caused by Low Density
Density Optimization Capabilities
Sequences multi-stop routes based on geographic proximity, customer delivery windows, and van shelf zone sorting.
Drivers capture barcode scans and doorstep delivery photos on standard phones within 20 meters of the delivery destination.
Interactive delivery countdown maps and live SMS alerts minimize doorstep dwell time and eliminate failed drops.
ROI & Scalability Framework for Density-Driven Fleets
When engineering delivery density, operations executives must measure financial returns across fuel savings, labor efficiency, asset preservation, and customer satisfaction. FleetRabbit delivers quantifiable financial return across all primary final-mile operating categories.
Stop Velocity ROI
Increasing temporal delivery density from 8 stops to 20 stops per hour more than doubles the delivery capacity of each driver, allowing carriers to expand revenue without adding vans or drivers.
Mileage Compaction
Compressing 100 sprawling daily miles into 35 tightly clustered route miles saves thousands in annual fuel burn while slowing depreciation on delivery van powertrains, brakes, and tires.
Unit Margin Expansion
Higher parcel volume per square mile dilutes fixed overhead expenses (vehicle insurance, dispatch software, depot lease), driving down overall fulfillment costs to industry-leading benchmarks.
Frequently Asked Questions: Delivery Density & Route Optimization
What is the difference between route density and delivery density?
Route density typically refers to the total volume of freight or stops distributed across an entire planned route mileage (stops per mile). Delivery density (or stop density) is broader, encompassing both the geographic concentration of stops within a specific physical boundary (stops per square mile) and the temporal velocity of delivery execution (stops per hour).
How does delivery density directly reduce last-mile delivery costs?
The last mile represents over 50% of total supply chain costs, primarily driven by driver labor wages and fuel burn during transit between stops. Higher delivery density reduces the distance and driving time between consecutive deliveries. Because the driver spends less time behind the wheel traveling between drop-offs, the fixed labor cost is divided across significantly more packages, lowering the cost per delivery.
How can a small delivery fleet improve density in rural or sprawling suburban areas?
Small delivery operations can increase density in suburban or rural zones by implementing scheduled delivery days (batching orders for specific postal codes on alternating days of the week), establishing localized drop-off lockers or commercial partner hubs, and setting geographic order-cutoff windows that encourage customer order clustering.
Does increasing delivery density compromise customer delivery time windows?
No. In fact, higher delivery density improves delivery window accuracy. When delivery stops are clustered tightly within a compact corridor, transit times between stops become shorter and far more predictable, minimizing the impact of highway traffic jams and allowing couriers to meet tight customer delivery windows consistently.
Unlock High-Density Delivery Efficiency Across Your Fleet Today
Compress transit miles, multiply daily driver stop velocity, and eliminate last-mile margin leakage with automated route clustering. Deploy FleetRabbit today with zero proprietary hardware lock-in.







