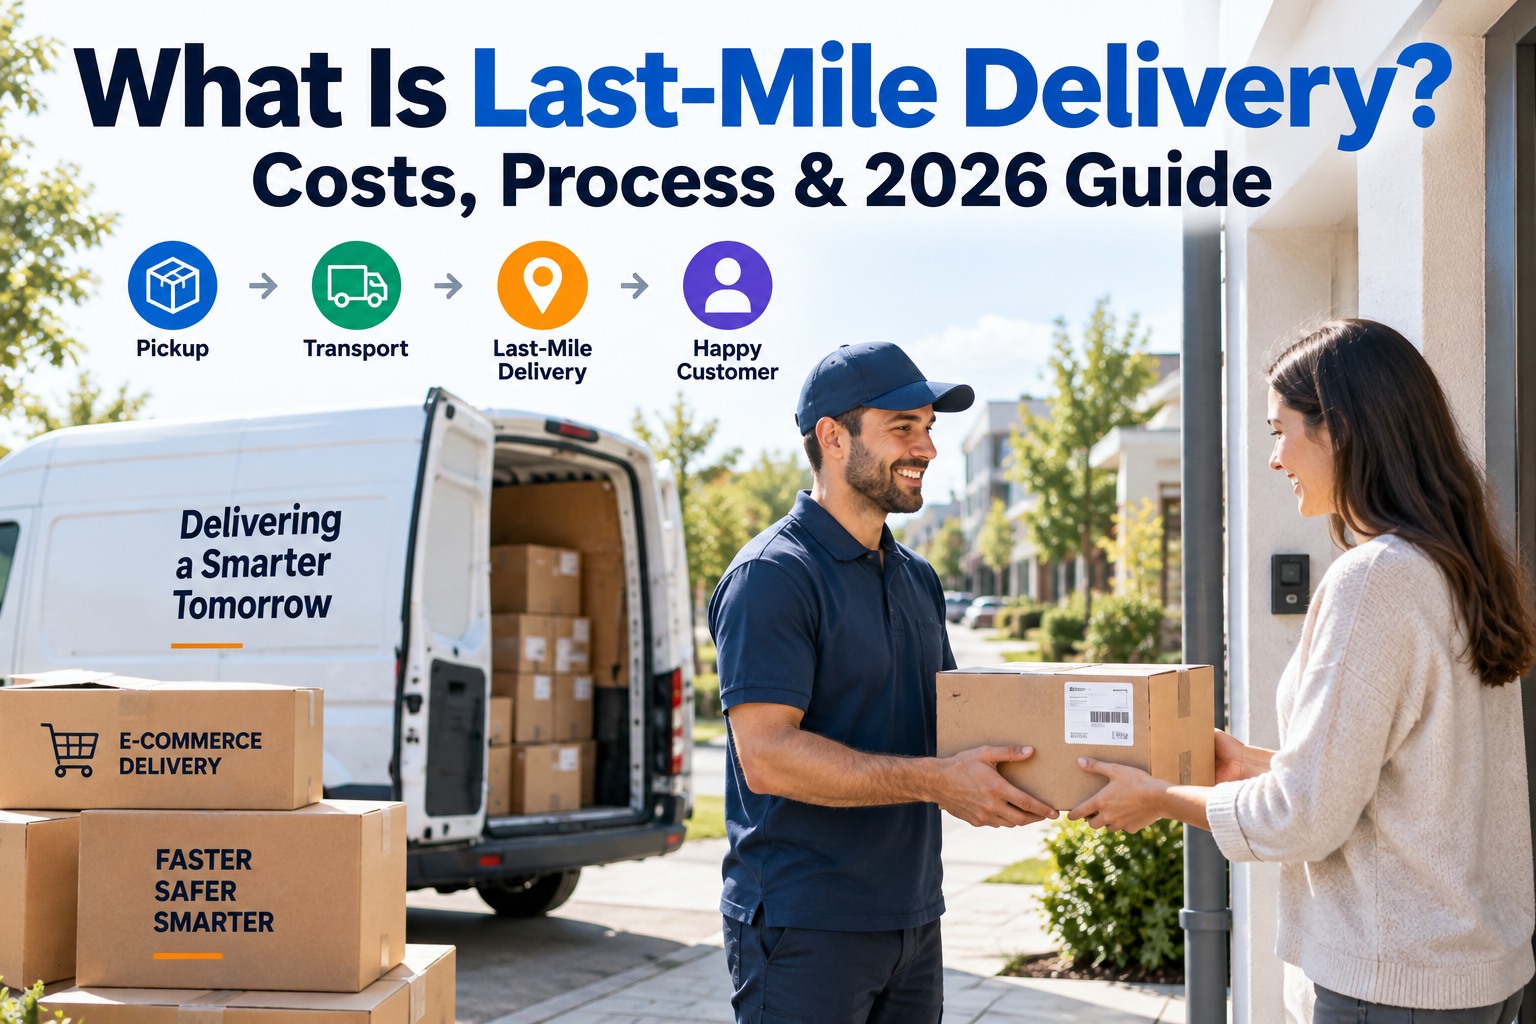
E-commerce operations executives, fulfillment directors, and contract carrier superintendents face an unforgiving economic reality: last-mile delivery represents the final, most expensive, and operationally vulnerable stage of the modern supply chain. Defined as the final transport step moving a parcel from a regional fulfillment hub or micro-fulfillment center directly to the customer's doorstep, last-mile logistics accounts for up to 53% of overall shipping expenses. When high delivery density is managed through static route sheets, unlinked courier communications, and reactive vehicle maintenance, logistics businesses suffer from costly failed first-attempt drop-offs, elevated fuel consumption from engine idling, customer disputes over missing packages, and rapid delivery van mechanical wear. Fleet Rabbit provides modern last-mile delivery software that pairs dynamic multi-stop route sequencing with mobile proof-of-delivery (POD), live vehicle OBD-II telematics, and automated preventive maintenance work orders. Compress cost-per-stop, raise first-attempt delivery rates, and scale parcel volume profitably. Book a Demo to explore our 2026 last-mile benchmark platform.
53%
Total Shipping Cost
The single largest cost bucket in the entire e-commerce logistics journey.
$10.10
Average Cost Per Stop
Average parcel drop cost across urban and suburban delivery zones.
8% – 12%
Failed First-Attempt Rate
Industry average without automated customer notifications and dynamic ETAs.
$5
Per Delivery Van / Month
Full fleet intelligence and routing engine with no onboarding markups.
Lower Your Cost-Per-Drop and Maximize Last-Mile Capacity
Automate parcel stop clustering, capture instant mobile photo delivery verifications, and prevent roadside van starter and brake breakdowns.
Sign up for your free trial or
book a demo to view our live last-mile operations console.
The 5 Sequential Stages of the Last-Mile Delivery Process
Understanding the mechanical and operational handoffs within the last mile is essential for finding and eliminating process bottlenecks between warehouse departure and customer doorstep reception.
Stage 01
Order Ingestion & Central Routing Centralization
Digital orders from e-commerce platforms (Shopify, WooCommerce, ERPs) arrive at the regional fulfillment hub. Intelligent algorithms cluster orders into dense neighborhood delivery zones based on vehicle cargo cubic limits and committed customer delivery windows.
Stage 02
Depot Staging, Sorting, & Vehicle Loading
Parcels are scanned into the staging bay and loaded in reverse sequence (first-in, last-out) into delivery vans and step trucks. Drivers perform mobile pre-trip DVIR checks to confirm tire pressures, lights, and cargo partition latches before departure.
Stage 03
Dynamic On-Road Routing & Real-Time Traffic Navigation
The driver departs on an optimized multi-stop path. Dynamic turn-by-turn navigation constantly evaluates live road congestion, bridge clearances, and left-turn reductions, updating estimated delivery windows automatically for both dispatchers and consumers.
Stage 04
Doorstep Drop-Off & Photo Proof-of-Delivery (POD)
At the destination, the courier scans the package barcode, verifies recipient delivery requirements, and captures a high-resolution doorstep placement photo or electronic customer signature via mobile app, immediately logging GPS coordinates and exact drop-off timestamps.
Stage 05
Real-Time Status Settlement & Exception Handling
Delivery data synchronizes back to central dispatch and the customer's tracking portal. If an address is inaccessible or a gate is locked, the exception triggers an immediate customer SMS notification or auto-schedules an optimized second-attempt loop.
Why Is Last-Mile Delivery So Expensive? Root Cost Drivers
Unlike middle-mile linehaul trucking where freight moves in bulk on highways, final-mile transport faces compounding micro-inefficiencies that elevate operating costs for delivery operations. Book a demo to inspect our cost-per-drop calculation models.
Cost Driver 1
Low Drop Density & Stop Idling
Suburban and rural routes require miles of driving between drops. Couriers frequently leave van engines idling during deliveries, wasting gallons of fuel and accelerating engine thermal wear.
Sign up to monitor engine idle burn.
Cost Driver 2
Failed First-Time Deliveries
When customers are not home for signature deliveries or apartment gates are impassable, returning a package to the depot and re-dispatching the following day doubles the handling and labor cost of that package.
Cost Driver 3
Customer Non-Receipt Claims & Porch Theft
Unverified parcel drop-offs leave carriers vulnerable to disputed deliveries and chargebacks. Without tamper-proof photo verification and geofencing, customer service absorbs costly refunds and claims investigations.
Cost Driver 4
Premature Van Maintenance Failures
Urban delivery vans endure continuous stop-and-go driving, placing severe strain on starter motors, brake pads, and batteries. Neglecting proactive maintenance leads to expensive mid-route breakdowns and towing fees.
Last-Mile Industry Benchmarks: 2026 Operational Metrics
Evaluate your parcel delivery operations against standard commercial performance benchmarks. Sign up now to track your fleet against these metrics.
| Operational KPI |
Top 10% Optimized Fleets |
Industry Average |
Unoptimized / Manual Fleets |
| Cost-Per-Drop (Urban) |
$3.80 – $5.20 |
$7.50 – $10.10 |
$12.50 – $16.00+ |
| Drops Per Driver Shift |
140 – 180 stops |
90 – 115 stops |
55 – 75 stops |
| First-Attempt Success Rate |
98.5% – 99.4% |
88.0% – 92.0% |
< 82.0% |
| Curb Idle Time Per Shift |
< 35 minutes |
75 – 110 minutes |
140+ minutes |
| Customer Claim Dispute Window |
< 60 seconds (Instant POD) |
24 – 48 hours |
5 to 7 days manual search |
| Software Cost Per Van |
$5 / month (Fleet Rabbit) |
$35 – $65 / month |
Hidden manual labor costs |
Core Software Solutions That Transform Last-Mile Margins
Modern delivery software turns chaotic paper manifests into streamlined, automated workflows that keep vans road-ready and drop volumes high. Book a demo to see our delivery optimization modules.
01
Dynamic Route Sequencing & Automated Stop Clustering
Optimize multi-stop delivery routes in seconds. Fleet Rabbit analyzes real-time traffic congestion, customer time windows, and vehicle cubic capacity to generate tight delivery clusters, eliminating driver backtracking and fuel waste.
Sign up to test our route sequencing engine.
02
Mobile Geofenced Photo Proof-of-Delivery
Couriers capture barcode scans, doorstep placement photos, and recipient e-signatures on an intuitive mobile app that timestamps and geotags every completed drop, closing out customer delivery inquiries in seconds.
03
OBD-II Telematics & Preventive Van Maintenance
Connect directly to van diagnostic ports to track engine run-hours, battery health, and active fault codes. Automatically schedule brake servicing, tire rotations, and oil changes before road breakdowns occur.
04
Paperless Pre-Trip DVIR Walkarounds
Drivers complete vehicle walkaround checklists on mobile devices in under two minutes. Reported defects—such as low tire pressure or cargo door sensor faults—instantly route to maintenance technicians as prioritized repair tickets.
Implementation Blueprint: Rolling Out Delivery Software in 4 Steps
Transition your last-mile delivery operations cleanly from static spreadsheets to Fleet Rabbit without missing customer delivery deadlines. Book a demo to plan your operational onboarding timeline.
Step 1
Fleet & Hub Ingestion
Upload vehicle profiles, cargo vans, driver rosters, and regional distribution hub geofences using standardized CSV templates.
Step 2
Routing & PM Configuration
Establish automated mileage and engine-hour intervals for brake checks and oil services based on live OBD-II telemetry.
Step 3
Mobile Driver Onboarding
Equip drivers with our mobile app for dynamic turn-by-turn routing, photo proof-of-delivery, and digital DVIR walkarounds.
Step 4
Live Dispatch Launch
Activate real-time route monitoring, live exception alerts, and centralized maintenance ticketing across your delivery footprint.
Customer Success Story: SwiftDrop Logistics
Learn how a growing regional delivery carrier optimized parcel drop density and eliminated roadside mechanical failures across 38 delivery vans.
Regional Parcel Carrier Lowers Cost-Per-Stop Across 38 Delivery Vans
Operating 38 cargo vans handling e-commerce deliveries across two metropolitan distribution hubs, SwiftDrop Logistics struggled with high cost-per-drop ($11.20 average), recurring starter motor burnouts, and dozens of weekly customer disputes over unverified doorstep drop-offs.
After deploying Fleet Rabbit, the company integrated dynamic route sequencing with predictive van maintenance and mobile photo proof-of-delivery. Emergency roadside repair calls dropped by 45%, cost-per-drop dropped to $6.80, and timestamped delivery photos eliminated customer dispute chargebacks entirely. Sign up to achieve similar results for your delivery fleet.
Frequently Asked Questions
What is the difference between middle-mile and last-mile delivery?
Middle-mile logistics involves transporting high volumes of packaged goods between major manufacturing plants, ports, and regional distribution centers using heavy tractor-trailers. Last-mile logistics is the final leg, moving individual parcels from local distribution hubs to consumers' residential doorsteps or retail store locations.
Book a demo to learn more about our last-mile dispatch tools.
Why does last-mile delivery make up over 50% of total shipping costs?
Unlike bulk linehaul transport, the last mile involves low drop density, heavy traffic congestion, extensive vehicle curb idling, individual doorstep stops, and high rates of failed delivery attempts. Labor hours and fuel burn per parcel are significantly higher during the final leg than any other stage of the supply chain.
How does photo proof-of-delivery protect carriers against false claims?
Fleet Rabbit's mobile app requires couriers to capture a clear doorstep drop-off photo and scan the package barcode. The app automatically attaches cryptographic timestamps and geofenced GPS coordinates, creating an unalterable delivery record that settles customer non-receipt inquiries in seconds.
Can delivery drivers use the mobile application in areas with poor cellular service?
Yes. Fleet Rabbit is built on an offline-first mobile architecture. Drivers can navigate routes, complete pre-trip DVIR walkarounds, scan parcels, and capture delivery photos without internet access. The data auto-syncs as soon as cellular or Wi-Fi connectivity returns.
Sign up free to test our offline mobile app.
What are the subscription rates and contract requirements for Fleet Rabbit?
Fleet Rabbit costs a flat $5 per delivery vehicle per month billed annually, offering complete access to dynamic route sequencing, mobile photo POD, vehicle telematics, and predictive maintenance tools. We provide a 14-day free trial on up to 3 vehicles with zero setup fees or long-term contract commitments.
Start your free trial today.
September 19, 2026
By Harper Lee
All Posts