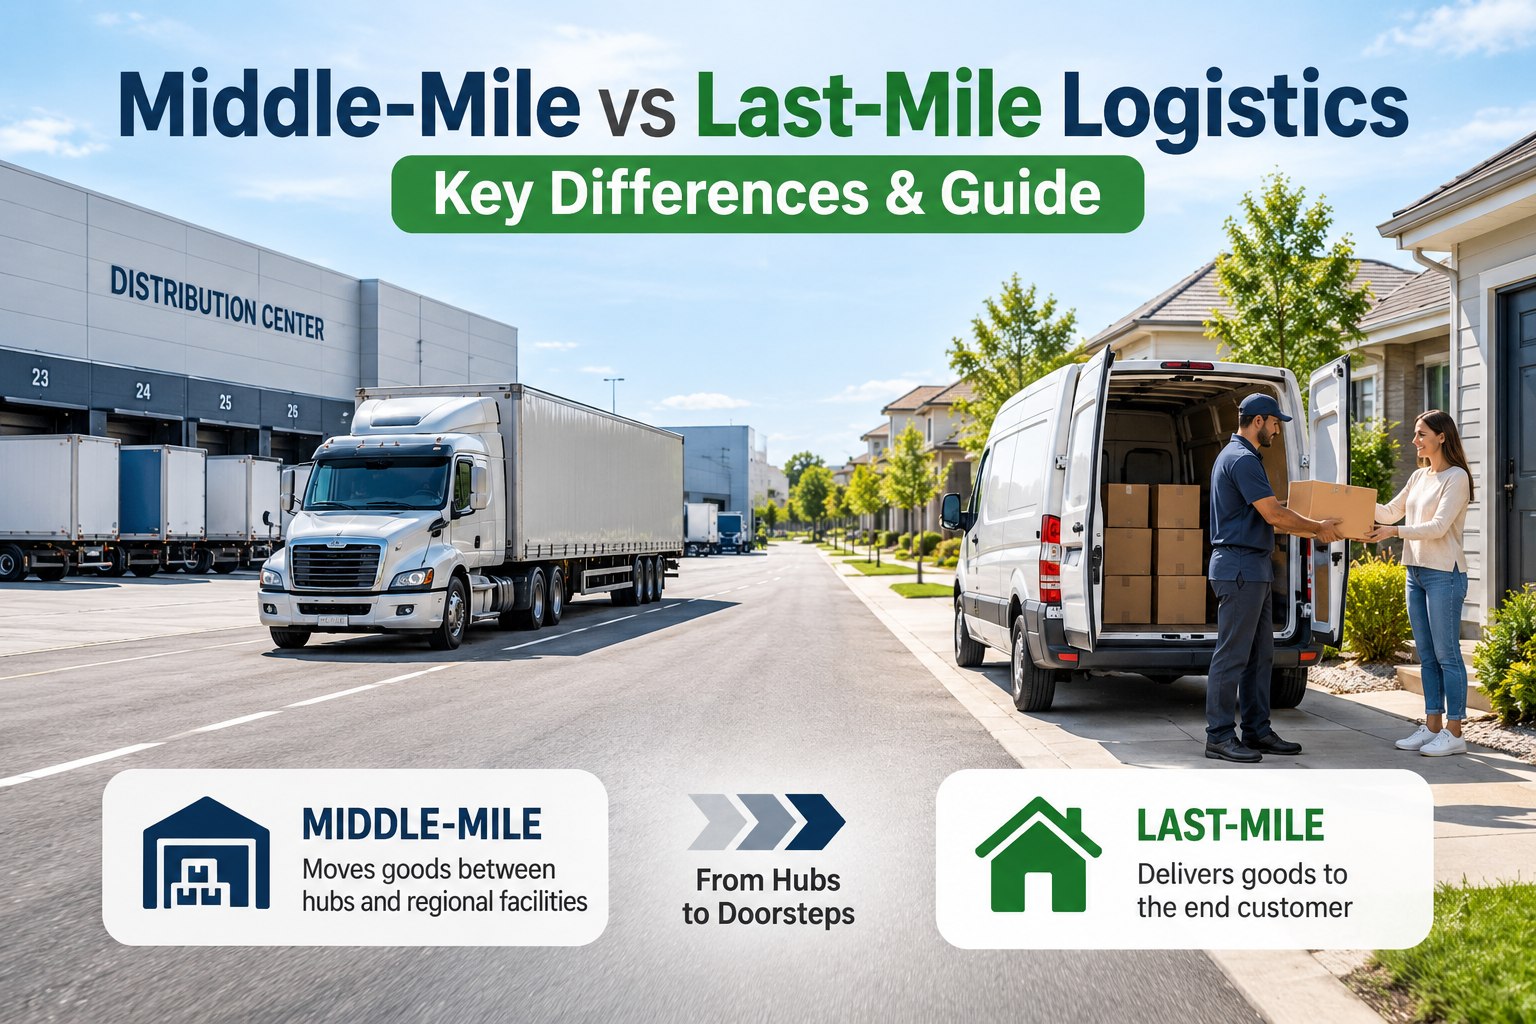
Modern supply chain directors, e-commerce transportation vice presidents, and 3PL executives evaluate middle-mile and last-mile coordination to eliminate friction across multi-tier delivery networks. In enterprise logistics, middle-mile operations focus on bulk line-haul transport, moving full truckloads (FTL) or less-than-truckload (LTL) freight between central manufacturing plants, port terminals, and regional distribution cross-docks. Conversely, last-mile logistics manages the high-touch, fragmented final leg—dispersing individual parcels, bulky furniture, or grocery totes from suburban delivery stations directly to residential doorsteps and commercial storefronts. When middle-mile line-haul schedules fall out of sync with last-mile sorting waves, sorting depots face severe dock congestion, couriers depart on delayed routes, and delivery cost-per-stop metrics surge. Unifying both stages with integrated fleet coordination software bridges line-haul telematics, dock arrival scheduling, street-level route sequencing, and verified proof-of-delivery into one synchronized operational picture. To see how our platform harmonizes cross-stage logistics workflows, book a live consultation demo with our supply chain engineering team or configure your operational network immediately through our free platform sign up.
Middle-Mile vs Last-Mile Logistics: Key Differences & Guide
A comprehensive operational guide comparing transport dynamics, unit economics, fleet profiles, key performance indicators, and digital coordination strategies across middle-mile and last-mile logistics.
Bridge the Operational Chasm Between Line-Haul and Final Delivery
Coordinate middle-mile freight schedules with dynamic last-mile route sequencing, driver proof-of-delivery, and vehicle maintenance starting from $3/vehicle/month with no hardware lock-in.
Core Operational Divergences: Comparing Middle-Mile and Last-Mile Transport
While both stages belong to the same freight journey, middle-mile and last-mile transport operate on contrasting physical, mechanical, and logistical principles. Middle-mile logistics prioritizes speed, aerodynamic efficiency, steady highway driving, and pallet density over predictable inter-facility corridors. In contrast, last-mile logistics demands street-level agility, repeated curbside parking, continuous stop-and-go engine cycling, pedestrian safety awareness, and direct consumer customer service. When supply chain organizations attempt to manage both stages through a single rigid framework, they create blind spots: line-haul freight tracking systems cannot sequence 150 residential parcel stops, while basic last-mile routing tools cannot handle heavy vehicle gross weight restrictions or trailer interchange slips. Logistics directors can evaluate multi-tier synchronization strategies by booking an interactive supply chain operations demo or configure test cross-dock workflows directly via our quick platform sign up.
Vehicular Fleet Profiles & Mechanical Demands
Middle-mile freight relies on heavy Class 7 and Class 8 tractor-trailers, box trucks with sleeper cabs, and regional yard spotters designed for sustained highway speeds. Last-mile fleets utilize Class 2 through 6 step vans, cargo vans, cutaways, and electric delivery vehicles built to endure 200 daily starter-motor cycles, curb mounting, and constant sliding door operations.
Cost Dynamics & Budget Allocation
Middle-mile expenses center on fuel burn-rate per ton-mile, driver hours of service (HOS), and highway toll management, typically accounting for 15% to 25% of total logistics costs. Last-mile represents the most expensive operational segment—often consuming 53% or more of total logistics spend—driven by curbside dwell time, failed delivery attempts, and customer disputes.
Route Topology & Navigation Logic
Middle-mile routes follow linear, hub-and-spoke corridors between fixed distribution centers with planned rest stops and designated industrial truck routes. Last-mile routes are highly variable, dynamic clusters traversing residential cul-de-sacs, gated apartment communities, and urban business centers with strict commercial delivery time windows.
Chain of Custody & Hand-Off Protocols
Middle-mile handoffs occur at secure warehouse loading bays via pallet-level electronic bills of lading (eBOL) and seal verifications between dock supervisors. Last-mile handoffs happen directly with end consumers, requiring geofenced barcode scans, doorstep photos, and recipient signatures to defend against merchant chargebacks.
Direct Benchmark Comparison: Middle-Mile vs. Last-Mile Logistics
Operating a synchronized supply chain requires understanding the distinct operational metrics that govern middle-mile efficiency versus last-mile execution. Review how performance targets, cost factors, technological requirements, and risk profiles differ across both distribution stages. Transportation vice presidents can evaluate custom cross-dock modeling by scheduling a tailored executive consultation demo or explore our unified logistics portal through self-service platform sign up.
| Logistical Dimension | Middle-Mile Logistics (Line-Haul) | Last-Mile Logistics (Final Delivery) | FleetRabbit Unified Advantage |
|---|---|---|---|
| Primary Objective | High-volume freight consolidation & inter-hub transit | Precise customer doorstep fulfillment & customer satisfaction | Seamless handoff from line-haul trailer to delivery van |
| Cost Share of Supply Chain | 15% to 25% of total shipment expenditure | 45% to 55% of total shipment expenditure | Optimizes overall unit economics across both stages |
| Governing Performance KPI | Cost per ton-mile • On-time dock arrival SLA | Cost per completed stop • First-attempt clearance | Unified end-to-end operational dashboard |
| Fleet Asset Profile | Class 8 tractors, 53ft trailers, straight trucks | Step vans, cargo sprinters, straight box trucks, EVs | Hardware-agnostic telematics across all vehicle classes |
| Driver Interaction Level | Low B2B touch; interacts with dock workers only | High B2C touch; represents brand at customer doorstep | Empowers couriers with customer SMS & e-POD tools |
| Primary Failure Risk | Highway congestion, trailer seal breach, missed dock slots | Failed first drop, locked gates, customer dispute claims | Automated ETA re-routing & geofenced photo proof |
4-Stage End-to-End Delivery Coordination Workflow
FleetRabbit standardizes freight movement from initial factory departure to final residential doorstep placement, establishing an unbroken digital thread across middle-mile and last-mile operations.
Bulk Line-Haul Staging
Pallets are scanned into 53ft line-haul trailers at regional fulfillment centers. Highway telematics track tractor engine hours, fuel efficiency, and real-time transit milestones.
Cross-Dock Synchronization
Line-haul arrival ETAs feed directly to local delivery hubs. Cross-dock crews receive advance manifest data to stage sort bays before the line-haul truck docks, eliminating yard waiting.
Dynamic Wave Sorting & 3D Van Packing
Incoming pallets break down into route-specific totes. Algorithms organize parcels into delivery van shelf zones based on street delivery order, package volume, and weight balance.
Curbside Execution & Ledger Reconciliation
Drivers navigate optimized routes, executing drops with geofenced barcode scans and photo verification. Real-time delivery receipts post back to enterprise ERP and WMS databases.
Financial Capital Preservation: Eliminating Cross-Stage Logistics Loss
Operating middle-mile line-haul and last-mile delivery fleets in separate management tools creates systemic operational leakage across delayed cross-dock staging, unmonitored route idling, and unverified delivery disputes. Identifying these hidden cost drivers helps operations leaders build a compelling business case for unified software adoption. Measure your delivery network's exact cost recovery by booking a personalized cost assessment demo or get started directly via our rapid platform sign up.
Top Causes of Multi-Stage Logistics Budget Waste
Unified Platform Capabilities
Unifies heavy Class 8 tractors (J1939 CAN-bus) and light delivery vans (OBD-II / mobile) in one operational view.
Real-time SMS alerts and live delivery countdown maps minimize missed drops and eliminate inbound customer calls.
Connects daily driver inspection walkarounds and engine trouble codes directly to garage mechanics for overnight service.
Enterprise Return on Investment & Fleet Scalability
When unifying middle-mile and last-mile operations under a single digital platform, supply chain leadership must evaluate both immediate cost reductions and long-term operating resilience. FleetRabbit delivers quantifiable financial return across cross-dock labor, vehicle maintenance, customer retention, and fuel efficiency metrics.
Dock Labor Savings
Synchronizing line-haul arrival times with local wave staging eliminates hours of morning cross-dock bottlenecking, allowing delivery vans to launch routes up to 35 minutes earlier every shift.
Doorstep Success Rate
Automated SMS notifications alert customers when their courier is two stops away, boosting first-attempt delivery success to 98.8% and preventing costly return-to-hub package re-delivery handling.
Predictive Fleet Care
Automated engine-hour tracking and diagnostic fault code monitoring generate proactive work orders for brakes, tires, and cooling systems across both line-haul tractors and delivery vans.
Frequently Asked Questions: Middle-Mile vs. Last-Mile Logistics
What is the exact physical boundary where middle-mile logistics ends and last-mile begins?
Middle-mile logistics typically concludes at the unloading dock of a local or regional delivery station, sortation facility, or cross-dock hub. Once the incoming line-haul freight is deconsolidated from bulk pallets into individual delivery packages and assigned to local delivery vans or couriers, the last-mile logistics phase begins.
Why is last-mile delivery significantly more expensive than middle-mile transportation?
Middle-mile freight benefits from high volume density and steady highway speeds, moving thousands of items simultaneously with minimal stops. Last-mile logistics involves low asset utilization per drop: a courier must navigate complex residential streets, find parking, locate apartment units, and handle packages individually, resulting in high fuel burn per unit and significant curbside dwell time.
Can our logistics organization manage both middle-mile and last-mile fleets using one software platform?
Yes. FleetRabbit is built on a modular, hardware-agnostic architecture. It ingests heavy-truck J1939 CAN-bus telematics for line-haul tractors while providing mobile driver applications for street-level route optimization, barcode scanning, geofenced photo proof-of-delivery, and customer notifications on last-mile routes.
How does middle-mile arrival synchronization improve last-mile courier delivery performance?
When line-haul arrival times are unpredictable, delivery cross-docks cannot efficiently stage parcels, forcing couriers to wait on loading pads and miss departure windows. Real-time middle-mile tracking gives sorting hubs accurate ETAs, allowing cross-dock teams to pre-sort packages and dispatch delivery vans on time to meet tight customer delivery windows.
Achieve Total Operational Harmony Across Every Logistics Mile
Eliminate cross-dock delays, optimize delivery routes, and equip your line-haul and courier teams with unified fleet intelligence. Deploy FleetRabbit today with zero proprietary hardware lock-in.







