A public works department rarely struggles to know where its dump trucks are supposed to be, the harder question is what those trucks are actually doing all day and whether the fleet size still matches the workload. GPS tracking answers the first question, utilization data answers the second, and together they are usually the fastest way a department can defend its budget in front of a council that is asking why more trucks are needed or whether some could be cut. FleetRabbit brings live location, idle-time detection, and utilization reporting into one system built for the way public dump truck fleets actually operate, including the rural stretches where signal drops out completely. Departments ready to see their own fleet mapped out can sign up and get started today.
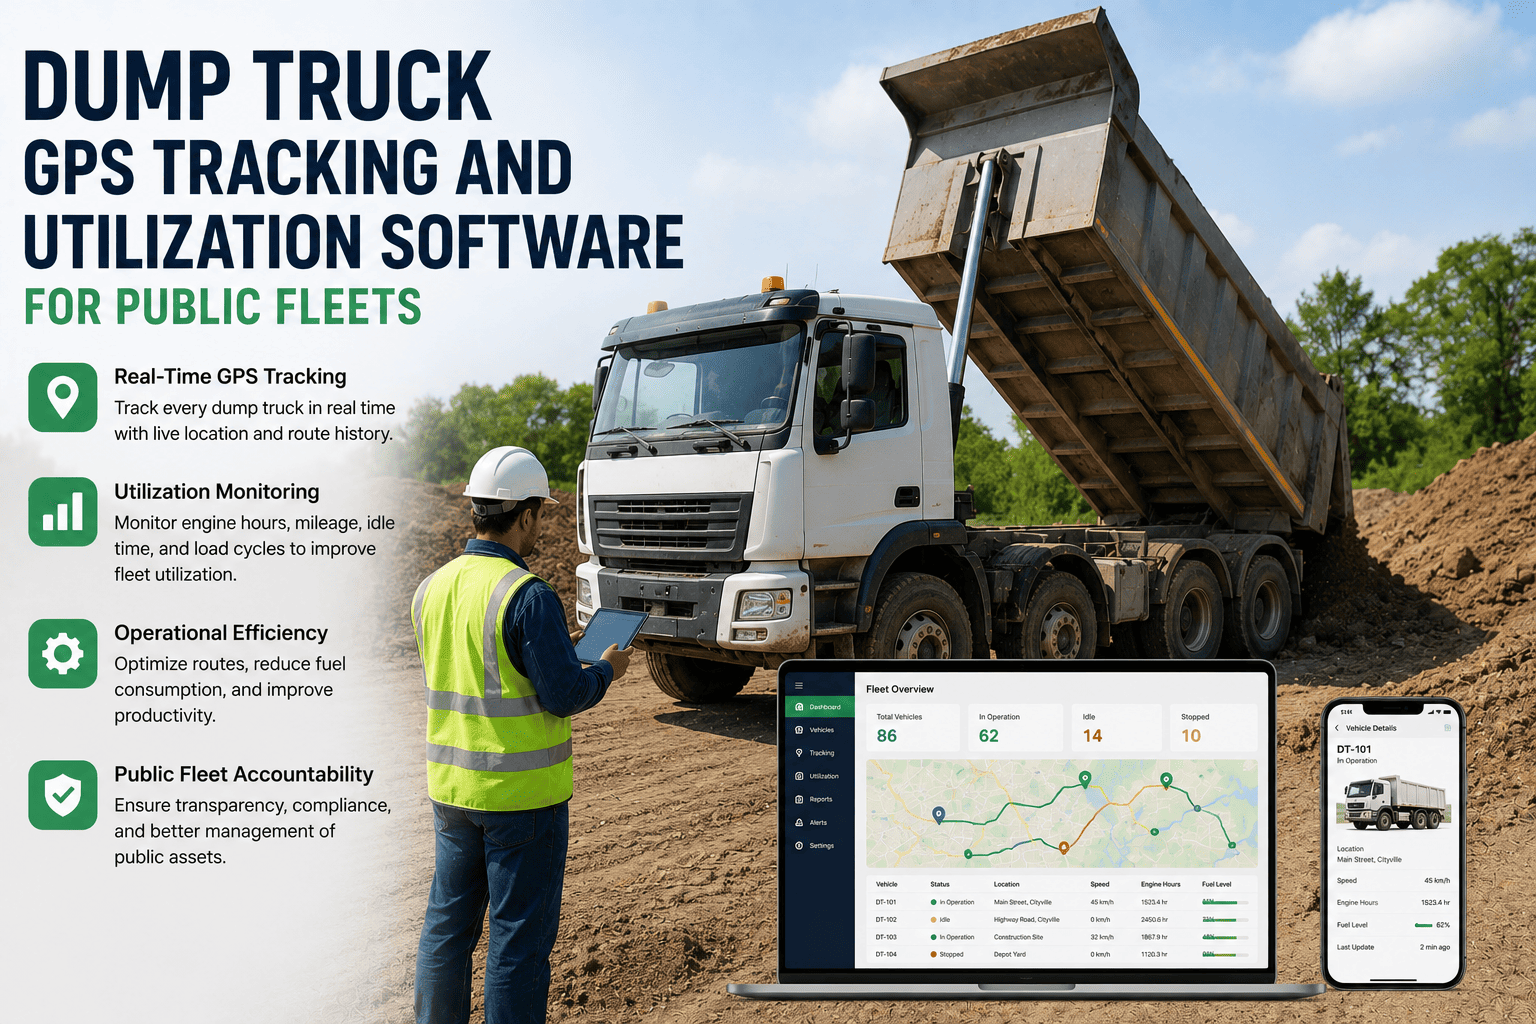
GPS tracking for a dump truck fleet needs to cover more than a blue dot on a map, it needs to answer where the truck went, how long it sat idle, and whether it stayed inside its assigned work zone.
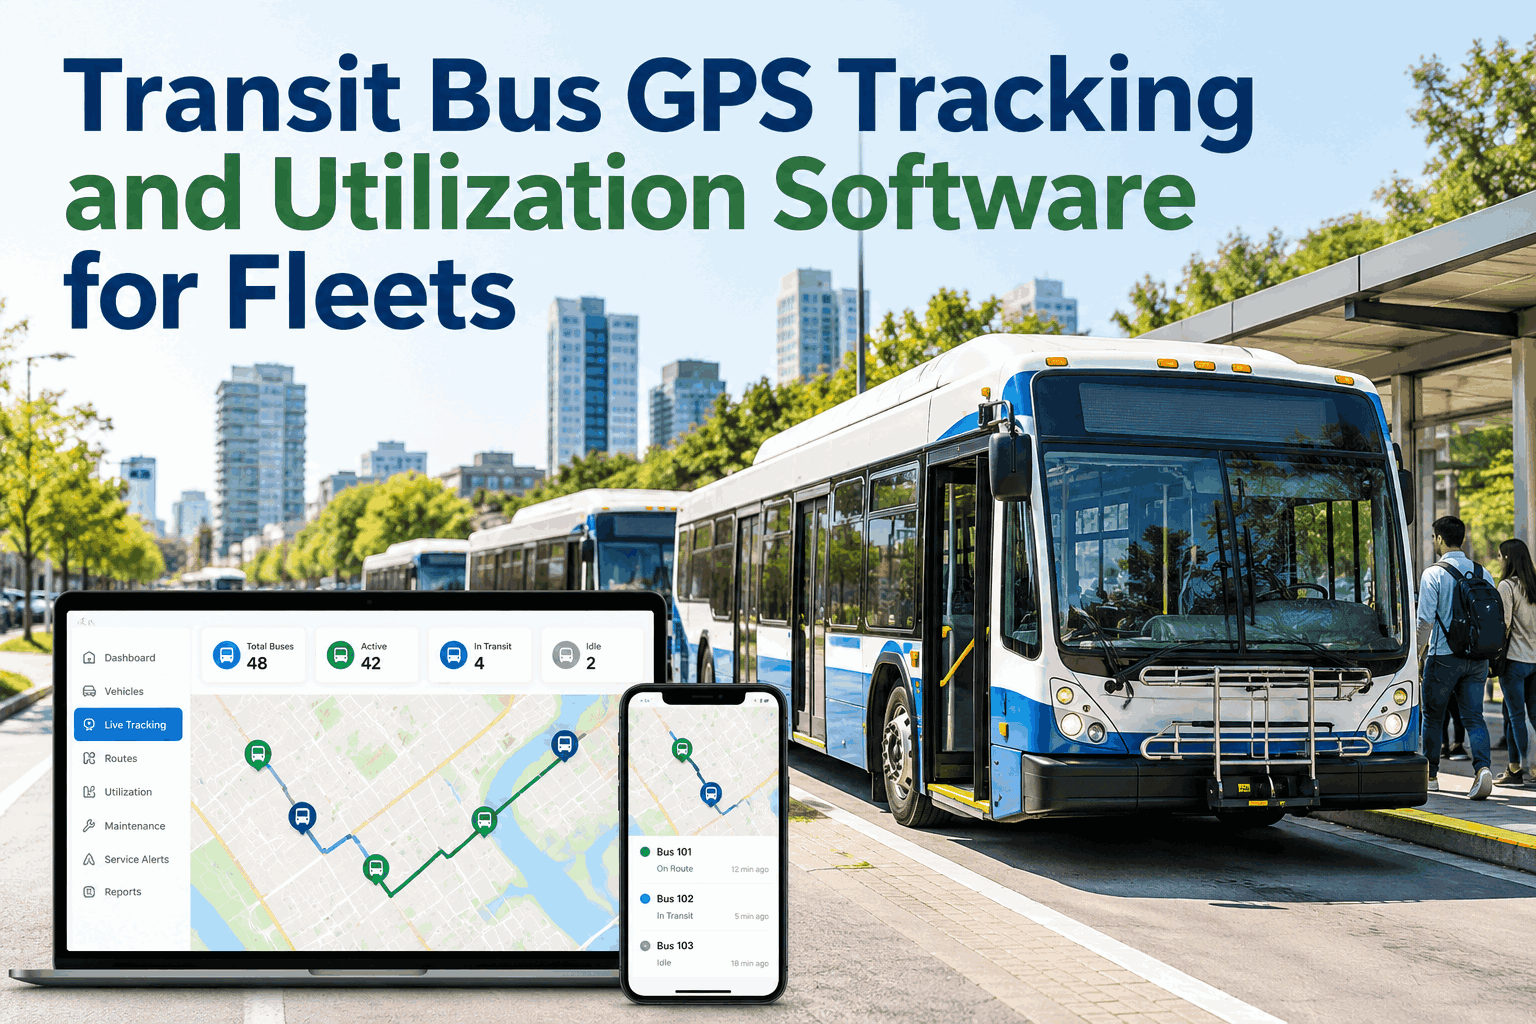
Real-time location and route history
Live position for every truck plus a full route history for any past shift, useful for both dispatch and after-the-fact review.
Idle-time and utilization detection
Automatic flagging of extended idle periods, separating productive haul time from time spent parked or waiting.
Geofencing and zone alerts
Instant alerts when a truck leaves its assigned work zone or enters a restricted area outside approved routes.
Offline tracking for rural coverage
Location data keeps recording locally when a truck runs through a dead zone, then syncs automatically once signal returns.
Most public dump truck routes cover a mix of dense city streets and rural stretches with unreliable cell coverage, which is exactly where basic consumer GPS tools tend to lose data entirely. Departments that need tracking built for that reality can book a demo and see how the offline sync actually works.
Utilization is the number that actually settles budget arguments, and it looks different truck by truck once the data is laid out honestly.
A truck sitting at a third of the fleet average utilization is either being underused, misassigned, or possibly no longer needed at all, and that is a very different budget conversation than a mechanical issue. Fleet managers who want this kind of visibility across their own roster can sign up and pull their real numbers.
Turn GPS data into a fleet size you can defend
Live tracking, idle-time detection, and utilization reporting built for public works dump truck fleets.
Signal dead zones are not an edge case for a rural dump truck route, they are a regular part of the day, which means offline handling cannot be an afterthought in the tracking system.
Truck moves through a coverage gap while the device keeps recording location locally
Signal returns and the buffered route history syncs automatically to the fleet dashboard
Utilization and route reports update with the complete trip, no gaps in the record
Without this kind of buffering, a rural route can show up in a report as a mysterious hole in the timeline, which is exactly the sort of gap that raises unnecessary questions during a records review.
When it is time to present fleet numbers to a council or budget committee, a handful of metrics come up almost every time.
| Metric | Why it gets asked about |
|---|---|
| Fleet-wide utilization rate | Shows whether the current truck count matches actual workload |
| Idle time trends | Highlights wasted fuel and operator time across the fleet |
| Route and zone coverage | Confirms trucks are working assigned areas efficiently |
| Cost relative to operating hours | Ties spending directly to actual usage rather than truck count alone |
Pulling these numbers together manually before a council meeting usually means several days of spreadsheet work under a tight deadline. Departments preparing for their next budget review can book a demo and see how quickly the same report comes together automatically.
| Task | Manual process | FleetRabbit |
|---|---|---|
| Location tracking | Basic GPS, often drops data in weak signal areas | Offline buffering with automatic sync |
| Utilization reporting | Manually estimated from logs or driver reports | Automatically calculated per truck and per fleet |
| Council or budget reporting | Compiled by hand before each meeting | Export-ready utilization and cost reports |
| Idle-time visibility | Rarely tracked in a structured way | Flagged automatically across the fleet |
Know exactly how the fleet is being used
Real-time tracking and utilization reporting that holds up in front of a council or a budget review.
Frequently asked questions
How is utilization different from just tracking mileage
Mileage only shows distance traveled, while utilization looks at how much of a truck's available time is spent doing productive work versus sitting idle or unused, which is a much more accurate picture for budget decisions.
What happens to GPS data when a truck loses signal
The device keeps recording location locally during the gap and automatically syncs the complete route once signal returns, so the record stays continuous instead of showing a blank period.
Can low utilization numbers help justify reducing fleet size
Yes, consistent low utilization on specific trucks is often the clearest evidence a department can bring to a budget conversation about right-sizing the fleet.
Does geofencing work well for large rural work zones
Yes, zones can be configured to match the actual size and shape of a work area, whether that is a small urban district or a large rural maintenance zone.
How does this connect to preventive maintenance scheduling
Engine-hour and mileage data captured through tracking can feed directly into PM scheduling, so utilization and maintenance timing stay linked rather than managed in separate systems.