Every transit agency owns more buses than it can see clearly. Some run from pull-out to pull-in, some sit in the yard as spares and some spend more time in the shop than on the street. Without live location and usage data, it is hard to know which is which, so spare counts, PM schedules and replacement plans all rest on guesses. GPS tracking that feeds utilization data changes that, because every bus, hour and mile lands in one record. See how FleetRabbit connects GPS tracking to utilization and engine-hour PM and put every bus to better use.
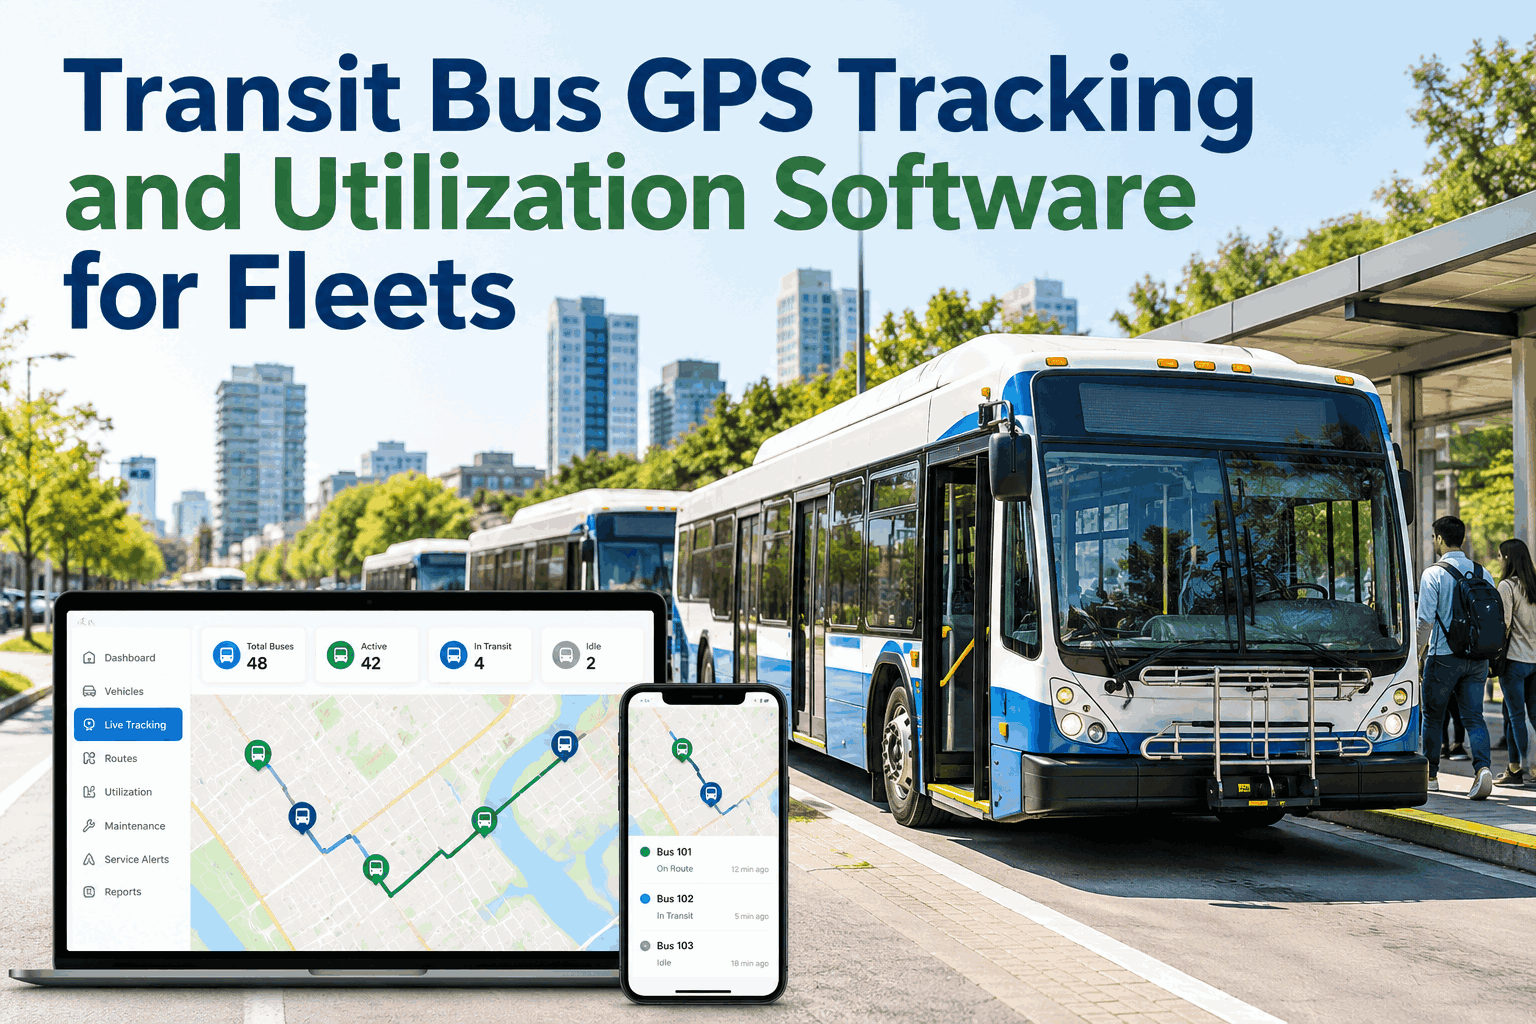
Transit Bus GPS Tracking and Utilization Software for Fleets
Know where every bus is, how hard it works and how many spares you really need. Turn GPS data into utilization numbers that drive smarter PM and fleet decisions.
Where a Bus's Day Really Goes
Three buses, three very different days. Utilization is the share of the day a bus earns its keep, and GPS shows the rest: deadhead runs, layovers and time out of service.
Illustrative schedule for three buses.
The Spare Ratio, in 36 Squares
The FTA guideline says agencies with 50 or more fixed-route revenue vehicles should keep spares to no more than 20% of the vehicles needed at peak. Smaller operators are expected to keep spares reasonable for their size and vehicle types.
Six Terms Every Utilization Report Uses
These come from NTD reporting, so keeping your tracking data aligned makes reports easier to build.
See Every Bus, Every Hour, in One System
Live GPS, utilization, engine-hour PM and service alerts for your whole transit fleet. Free for your first three vehicles.
If You See This, Do That
Utilization data is only useful when it changes a decision. Here are four common patterns and what they usually point to.
Even Out the Wear With Smarter Rotation
When a few buses take most of the hours, they hit PM, repairs and end of life first while others sit. Utilization data shows the imbalance so you can rotate assignments.
Annual engine hours per bus. Illustrative example with the same total hours in both charts.
What FleetRabbit Tracks for Every Bus
GPS is the start. The real value is connecting it to maintenance. Start free and see location, hours and service history on one record.
Frequently Asked Questions
It shows where each bus is in real time, stores route history and reports on usage such as run time, idle time and hours, so agencies can manage service and maintenance from one system.
It measures how much of the fleet's available time and mileage goes to revenue service compared with deadhead, layover, idle and time out of service.
It is spare vehicles divided by vehicles operated in maximum service. FTA guidance says agencies with 50 or more fixed-route revenue vehicles should generally not exceed 20%, and smaller agencies should keep spares reasonable.
Deadhead is the miles and hours a bus travels when it is not in revenue service, such as moving between the garage and the start of a route.
Buses spend long stretches idling at layovers and running at low speeds. Engine hours capture that wear, so PM can follow real use as well as miles.
Yes. You can start free with three vehicles and add more as your fleet grows.
Put Every Bus to Work and Keep Every Bus Ready
GPS tracking, utilization, engine-hour PM, inspections, alerts and repair history for your whole transit fleet in one system. Free for your first three vehicles.