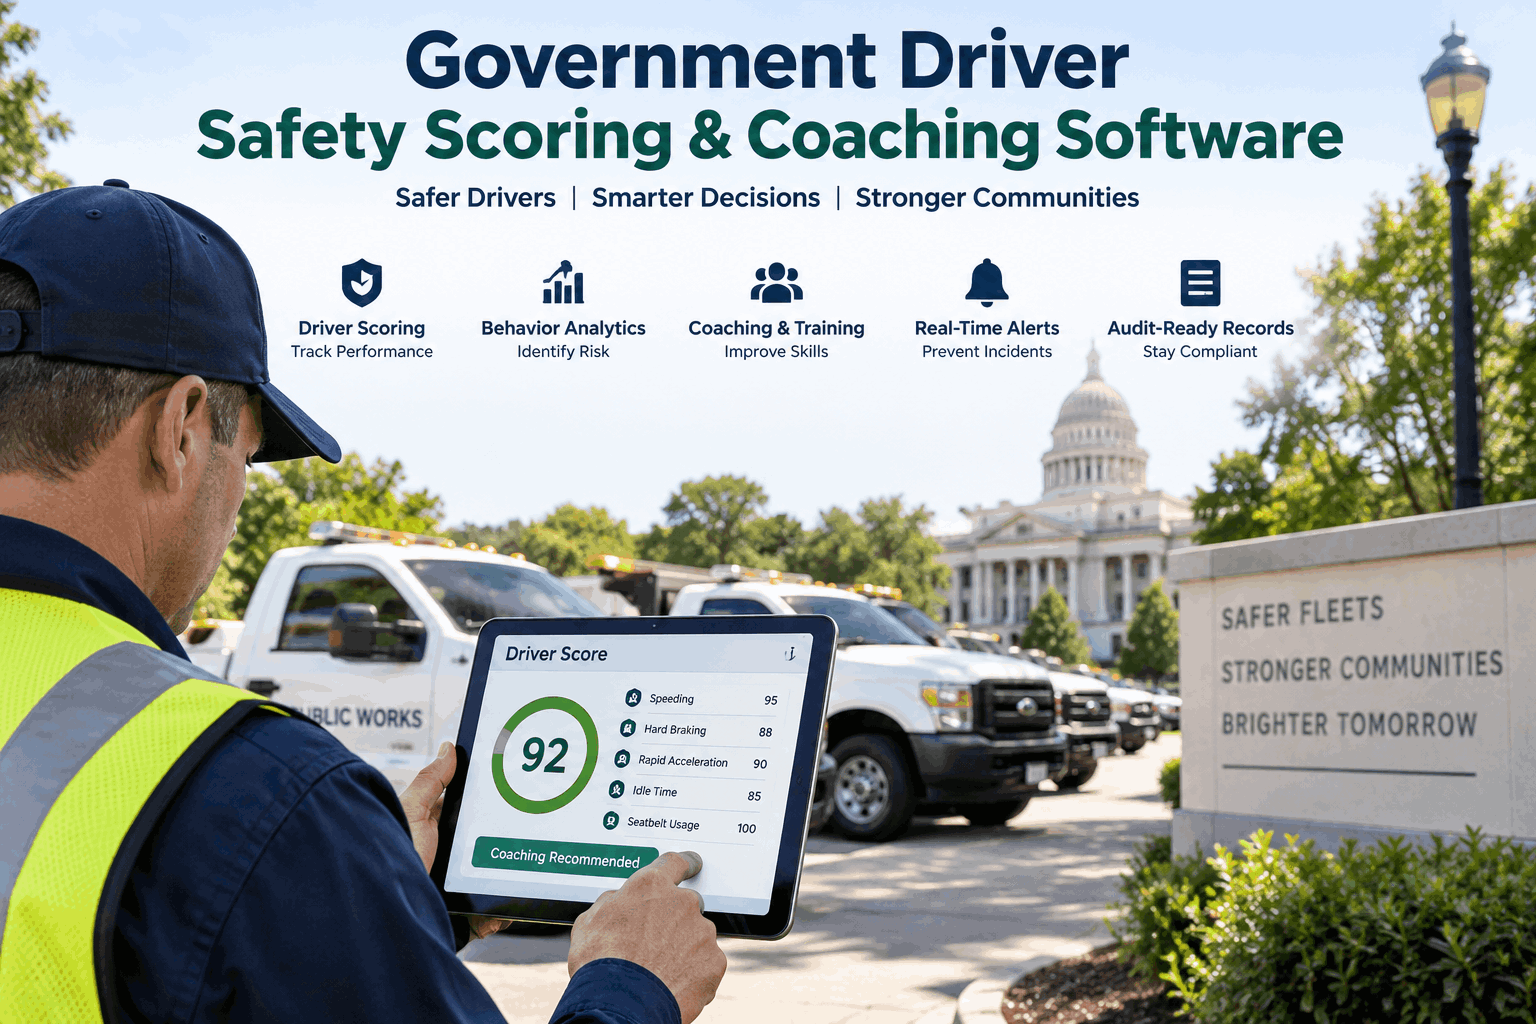
Municipal risk managers, public safety directors, and county fleet superintendents carry an immense public responsibility: protecting citizen safety, preserving municipal budgets, and safeguarding tax-funded vehicles on civilian roadways. Government driver safety scoring and coaching software transforms raw in-cab telematics, inertial G-force sensors, and OBD-II diagnostics into transparent, objective driver safety scorecards and automated coaching queues. When civic operations lack continuous driver monitoring, aggressive municipal driving habits—including high-speed emergency response maneuvers, harsh braking in school zones, seatbelt non-compliance, and rapid acceleration in heavy public works dump trucks—remain unchecked until a catastrophic at-fault collision occurs. Disputed collision liabilities, nuclear liability settlements, surging self-insured retention pool costs, and public relations fallout drain vital municipal general funds. Fleet Rabbit delivers a purpose-built public sector driver safety platform that balances objective 0–100 safety grades, in-cab audio micro-alerts, structured supervisor debriefs, and verifiable risk records. Identify high-risk driving habits before collisions happen, motivate municipal operators with transparent safety benchmarks, and protect taxpayer capital across every civic department. Book a Demo to see our government driver safety scoring software in action.
Government Driver Safety Scoring & Coaching Software
An actionable operational safety blueprint for municipal and county leaders: turn vehicle telemetry into balanced safety grades, automate structured 2-minute supervisory coaching, eliminate disputed municipal collision liabilities, and defend taxpayer reserves.
The Public Sector Exposure: Unmonitored Government Driving Habits
Civic operators maneuver marked government vehicles through tight residential neighborhoods, pedestrian-dense downtown corridors, and school transit routes. When unsafe behaviors go unmonitored, the liabilities fall directly on municipal general funds and local taxpayers. Sign up to identify high-risk driving behaviors across your civic fleet.
The Objective 0–100 Government Safety Scorecard Formula
To secure labor union acceptance and driver trust, safety evaluations must rely on an objective, weighted mathematical framework that normalizes events per operating hour and mile. Every operator starts each evaluation shift with a perfect 100 score. Book a demo to see our customizable scorecard weighting engine.
Driver Risk Tiers & Automated Supervisory Intervention Levels
Categorizing operators into standardized risk tiers allows municipal safety directors to allocate coaching time effectively without micro-managing safe drivers. Book a demo to explore our supervisory coaching modules.
| Safety Score Tier | Risk Band | Telemetry Event Frequency | Supervisory Action Trigger | Civic Recognition & Standing |
|---|---|---|---|---|
| 90 – 100 | Exemplary / Low Risk | < 0.5 infractions per 100 miles | No intervention; positive recognition | Eligible for annual municipal driver safety awards |
| 80 – 89 | Standard / Proficient | 0.5 – 1.5 infractions per 100 miles | Automated weekly shift recap to mobile app | Normal operating good standing |
| 70 – 79 | Moderate Risk | 1.6 – 3.0 infractions per 100 miles | Mandatory 2-minute 1-on-1 supervisor debrief | Safety review status; re-check in 30 days |
| < 70 | High Risk / Critical | > 3.0 infractions per 100 miles | Immediate ride-along evaluation & retraining | Corrective action plan; route re-assignment |
The 4-Pillar Operator Coaching & Feedback Architecture
Public fleet safety software must prioritize positive behavioral coaching over punitive measures to foster genuine safety culture and avoid labor disputes. Sign up to automate driver safety coaching workflows.
Platform Comparison: Manual Oversight vs. Fleet Rabbit Safety Suite
Compare the operational, financial, and legal differences between manual supervisor spot-checks and Fleet Rabbit’s connected public sector platform. Book a demo to evaluate your agency's safety ROI.
| Safety Management Dimension | Fleet Rabbit Safety Suite | Manual Supervisor Spot-Checks | Generic Commercial GPS Trackers |
|---|---|---|---|
| Subscription Rate | $5 / asset / month | High claim payouts & admin labor | $25 – $45 / vehicle / month |
| Objective 0–100 Scoring | Native weighted algorithm | Subjective manager opinion | Basic raw event counts only |
| Posted Speed Limit Matching | Street-level commercial GIS data | None; relies on citizen complaints | Basic highway limits only |
| In-Cab Real-Time Alerts | Instant audio tone self-correction | None; feedback delayed weeks | Optional expensive hardware add-on |
| Supervisory Coaching Workflows | Automated 1-click coaching cards | Unrecorded verbal conversations | Not supported |
| Tort Claim Legal Defense Dossiers | 1-click immutable export | Paper filing cabinets | Manual spreadsheet exports |
| Contract & Deployment | 14-day free trial, live in 14 days | Not applicable | 1 to 3-year locked RFP contracts |
Municipal Case Study: City of Oakridge Public Works & Utilities
Learn how a municipal fleet department deployed driver safety scoring across 58 civic vehicles to slash preventable vehicle damage. Sign up to achieve similar safety improvements for your municipality.
Operating 58 vehicles across Streets, Water Utility, and Parks divisions, the City of Oakridge faced rising costs from minor backing collisions, scraped guardrails, and recurring pedestrian speeding complaints. The city's self-insured retention pool threatened a $45,000 deductible increase unless driver risk governance was modernized. Furthermore, garage mechanics were replacing brake pads on heavy tandem dump trucks every 14,000 miles due to aggressive driving.
By implementing Fleet Rabbit at $5/asset/month, the city introduced transparent 0–100 driver safety scorecards and enabled real-time in-cab audio coaching. Municipal operators embraced the objective metrics, using the mobile app to review shift performance privately. Over 12 months, preventable collisions fell by 56%, average fleet safety scores rose from 74 to 94.8, brake pad wear intervals extended by 35%, and the city documented driver coaching sessions to secure a $68,000 annual reduction in insurance pool contributions and maintenance costs.