Public works, emergency services, and county utility fleets cannot afford unexpected mechanical failures during critical operations—whether during a snow emergency, water main break, or routine refuse route. Yet municipal shop supervisors frequently fight an uphill battle against aging rolling stock, supply-chain delays on heavy-duty replacement parts, and unpredictable emergency tow bills. Shifting from reactive scheduling to sensor-driven predictive maintenance allows public fleets to diagnose component degradation before catastrophic failure occurs, dropping fleet-wide out-of-service rates to under 4%. FleetRabbit unifies telematics-derived DTC fault codes, engine health trends, automated work order dispatch, and municipal budget planning into one centralized platform. Book a 30-minute demo to see predictive diagnostics in action or explore our live fleet platform.
Hero Section: Predictive Downtime Command CenterPredictive Fleet Analytics: Cracking the < 4% Downtime Threshold
Bridging heavy equipment telemetry, emergency duty cycles, and automated work orders to prevent roadside failures across public fleets.
Stop Managing Municipal Fleets by Breakdown
Empower your city or county maintenance team with sensor-level failure prediction and automated parts reservation.
Why Municipal Fleets Suffer From High Downtime Rates
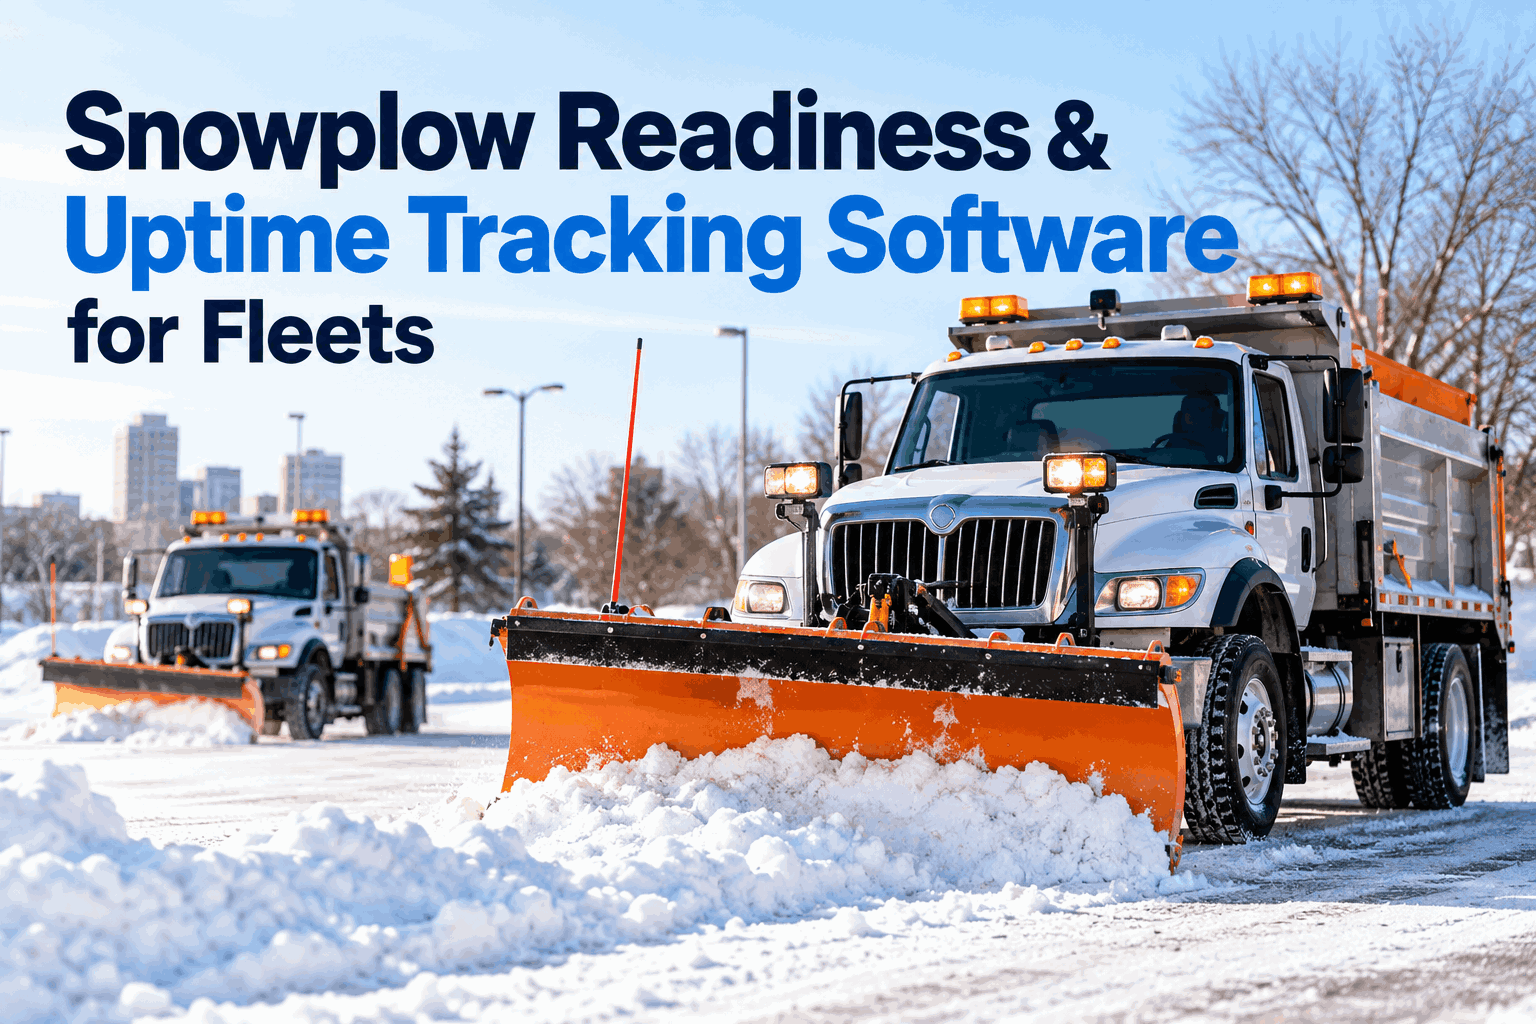
Unlike commercial interstate freight that cruises under steady highway conditions, government and municipal fleets operate in the harshest duty cycles imaginable. Police interceptors run with protracted engine idle times that degrade oil film strength and bake electrical harnesses. Refuse packers undergo thousands of low-speed hydraulic and brake cycles per day. Winter snowplows operate in corrosive salt baths with high mechanical resistance. When fleets rely on calendar-based or generic mileage-based intervals (e.g., "service every 5,000 miles or 6 months"), these brutal operating conditions are ignored until warning lights illuminate on the dashboard.
By the time an engine light flashes or an engine de-rates into "limp mode," the minor wear that could have been resolved with an inexpensive sensor or fluid flush has escalated into a wiped camshaft, melted turbocharger, or damaged exhaust aftertreatment system. The result is vehicles sitting idle for weeks waiting on hard-to-source municipal parts, forcing operations managers to rent reserve apparatus at inflated taxpayer expense.
The 4 Predictive Mechanisms GridIdle-Adjusted Engine Hour Analytics
Tracks actual engine revolutions and thermal strain rather than mere odometer miles. Essential for public safety and utility apparatus that idle for hours on scene.
Sensor Stream Trend Extrapolation
Monitors gradual shifts in exhaust gas temperatures, fuel rail pressures, and coolant drop-offs, identifying sub-critical failure slopes weeks before a check-engine light trips.
Automated J1939 / OBD-II Triage
Instantly classifies incoming DTC codes into critical vs. non-critical fault levels. FleetRabbit automatically generates shop repair tickets and alerts parts managers to stage filters or solenoids.
Historical Failure Clustering
Cross-references failure histories across specific vehicle make, model, and year cohorts (e.g., 2021 vocational chassis steering gears or 2019 pumper PTO pumps) to initiate targeted service campaigns.
Downtime Strategy Comparison: Reactive vs. Preventive vs. Predictive
Municipal fleet management has evolved through three distinct operating doctrines. Understanding where your agency sits is the first step toward reclaiming operational capacity and defending your capital budget.
| Operational Metric | Reactive (Run-to-Failure) | Standard Preventive (PM) | FleetRabbit Predictive (PdM) |
|---|---|---|---|
| Fleet Out-of-Service Rate | 12% – 18% | 8% – 11% | < 3.8% |
| Maintenance Trigger | Driver breakdown or fatal malfunction | Fixed mileage / calendar thresholds | Continuous real-time component health |
| Parts Inventory Staging | High emergency freight fees, stock-outs | Bulk ordering based on estimates | Just-in-time reservations tied to wear slopes |
| Overtime Labor Costs | Frequent off-hours emergency call-outs | Moderate scheduled weekend shop work | Controlled shop loading, minimal emergency OT |
| Public Service Impact | Missed trash routes, delayed storm response | Periodic asset unavailability | Maximized front-line mission readiness |
Cost Breakdown: What a 1% Drop in Downtime Means to Your City
For a municipal or county government operating 150 to 300 mixed assets, reducing overall downtime is not just a shop metric—it directly frees up municipal capital that would otherwise be tied up in spare units, emergency towing, and outsourced repair invoices.
The Cascading Cost of Government Fleet Downtime
Heavy apparatus recovery requires specialized towing, street clearings, and potential hazmat fluid sweep expenses.
Fleets maintain a 15% surplus reserve buffer purely to backstop unpredicted garage downtime.
Ignoring a slipping fan clutch or failing EGR valve leads to blown head gaskets, melted cylinder liners, or cracked blocks.
Achievable Annual Savings (200 Mixed Assets)
The 4-Phase Roadmap to Under 4% Out-of-Service Rates
Transitioning an entire municipal or county fleet from legacy spreadsheets to automated predictive maintenance does not require ripping out existing shops or retraining mechanics on complex data science tools.
Telemetry & Engine Diagnostic Onboarding
Connect vehicles via OBD-II, J1939, or native OEM telematics (Ford Pro, GM Envolve, Cummins Connected). FleetRabbit automatically starts compiling continuous sensor streams without extra shop hardware.
Duty-Cycle Baseline & Idle Calibration
The platform separates engine run time into active road speed, PTO work, and excessive stationary idle. Maintenance triggers automatically switch to dynamic fuel-burn and thermal duty factors.
Pre-Emptive Work Order Dispatching
When an alternator ripple or soot-load rate diverges from healthy baseline, FleetRabbit generates a low-priority shop work order, orders the required filter or belt, and slots repair before peak mission hours.
Council-Ready Budget & Lifecycle Reporting
Real-time vehicle condition metrics seamlessly link with capital asset accounting and GASB 34 reporting, proving to town administrators and elected councils that maintenance dollars are actively extending asset lifespans.
Frequently Asked Questions
Does FleetRabbit work on older municipal heavy equipment without modern telematics?
Yes. FleetRabbit supports hybrid municipal operations. Modern apparatus connect via plug-and-play telematics gateways or native OEM data streams, while older legacy yellow iron or utility equipment can be monitored via auxiliary battery/vibration sensors and digital mobile inspections that feed condition indices directly into the predictive engine.
How does predictive maintenance help justify our annual capital budget to city council?
City councils often view fleet budgets with skepticism, assuming maintenance departments request excessive funds. FleetRabbit outputs clear, council-ready health dashboards illustrating vehicle degradation curves, true cost-per-engine-hour, and remaining useful life. You can clearly demonstrate which units have surpassed their economic repair point and which can be reliably preserved.
Can FleetRabbit integrate with existing municipal inventory systems?
Yes. FleetRabbit offers bi-directional API interfaces and pre-built integrations with major municipal ERP platforms (including Tyler Technologies, SAP, and CentralSquare). This ensures that when a predictive maintenance alert triggers a work order, part counts and purchase orders update automatically without double-entry.
How quickly can a public works department expect to see downtime drop?
Most public fleets identify critical unaddressed faults within the first 14 to 30 days of telemetry activation—often detecting failing charging systems, coolant temperature spikes, and clogged DPF filters before they cause catastrophic breakdown. Fleets consistently hit under 4% downtime within 3 to 6 months of rollout.
Cut Downtime. Eliminate Emergency Towing. Protect Your Budget.
Join forward-thinking municipalities and public works teams using FleetRabbit to safeguard critical vehicle uptime and streamline municipal operations.