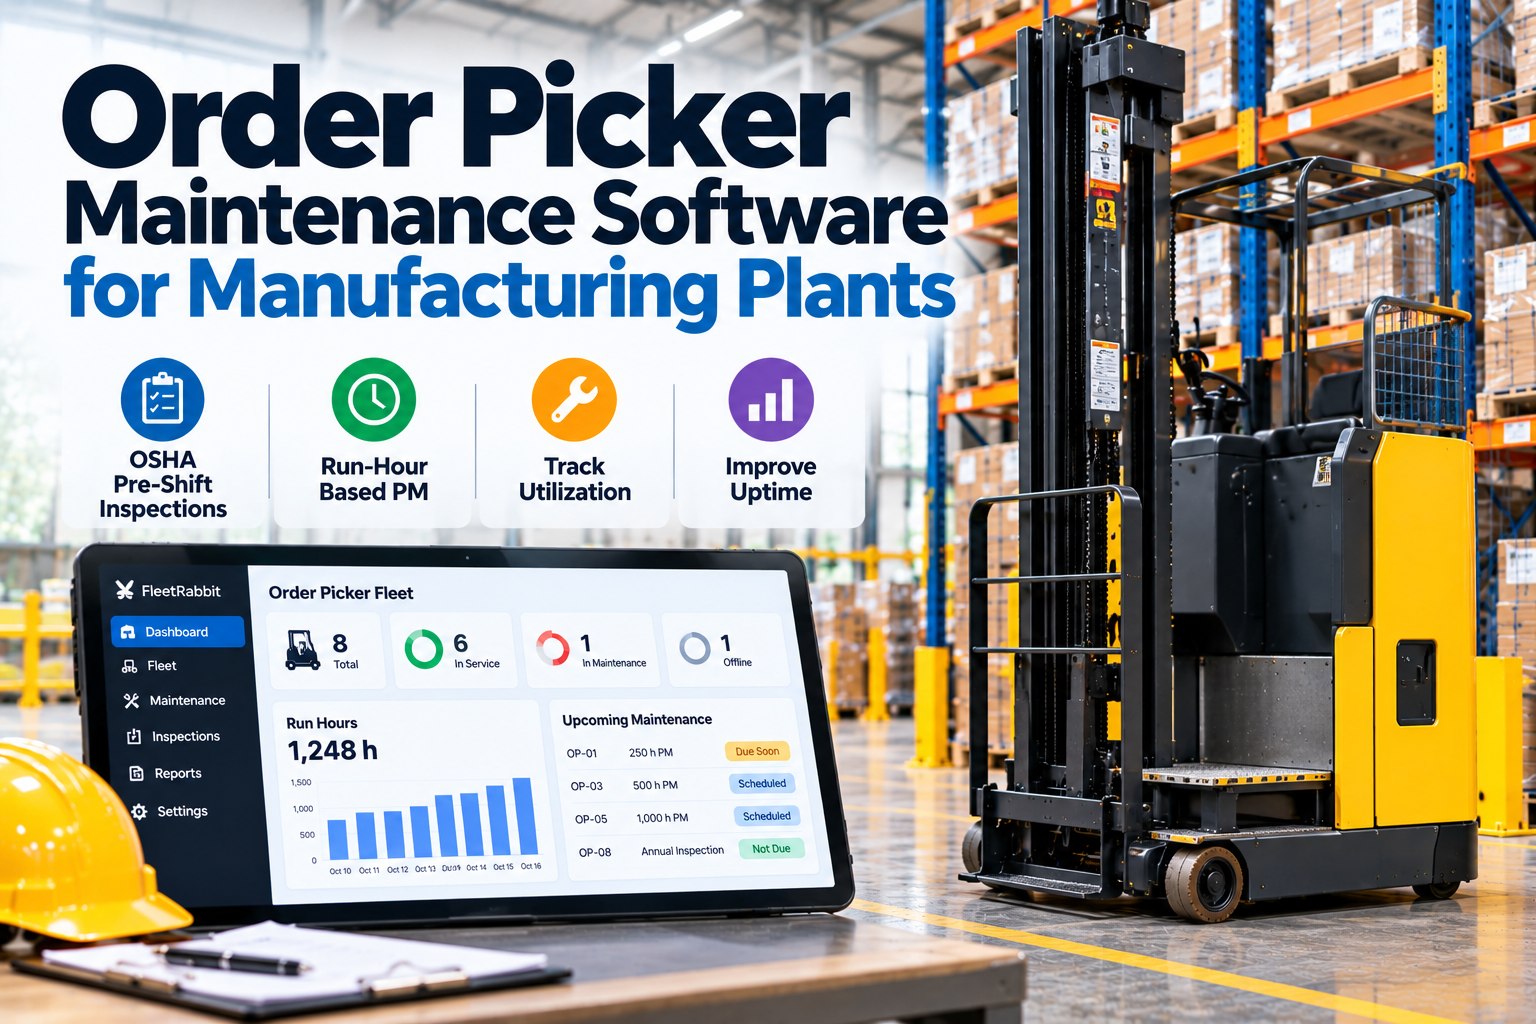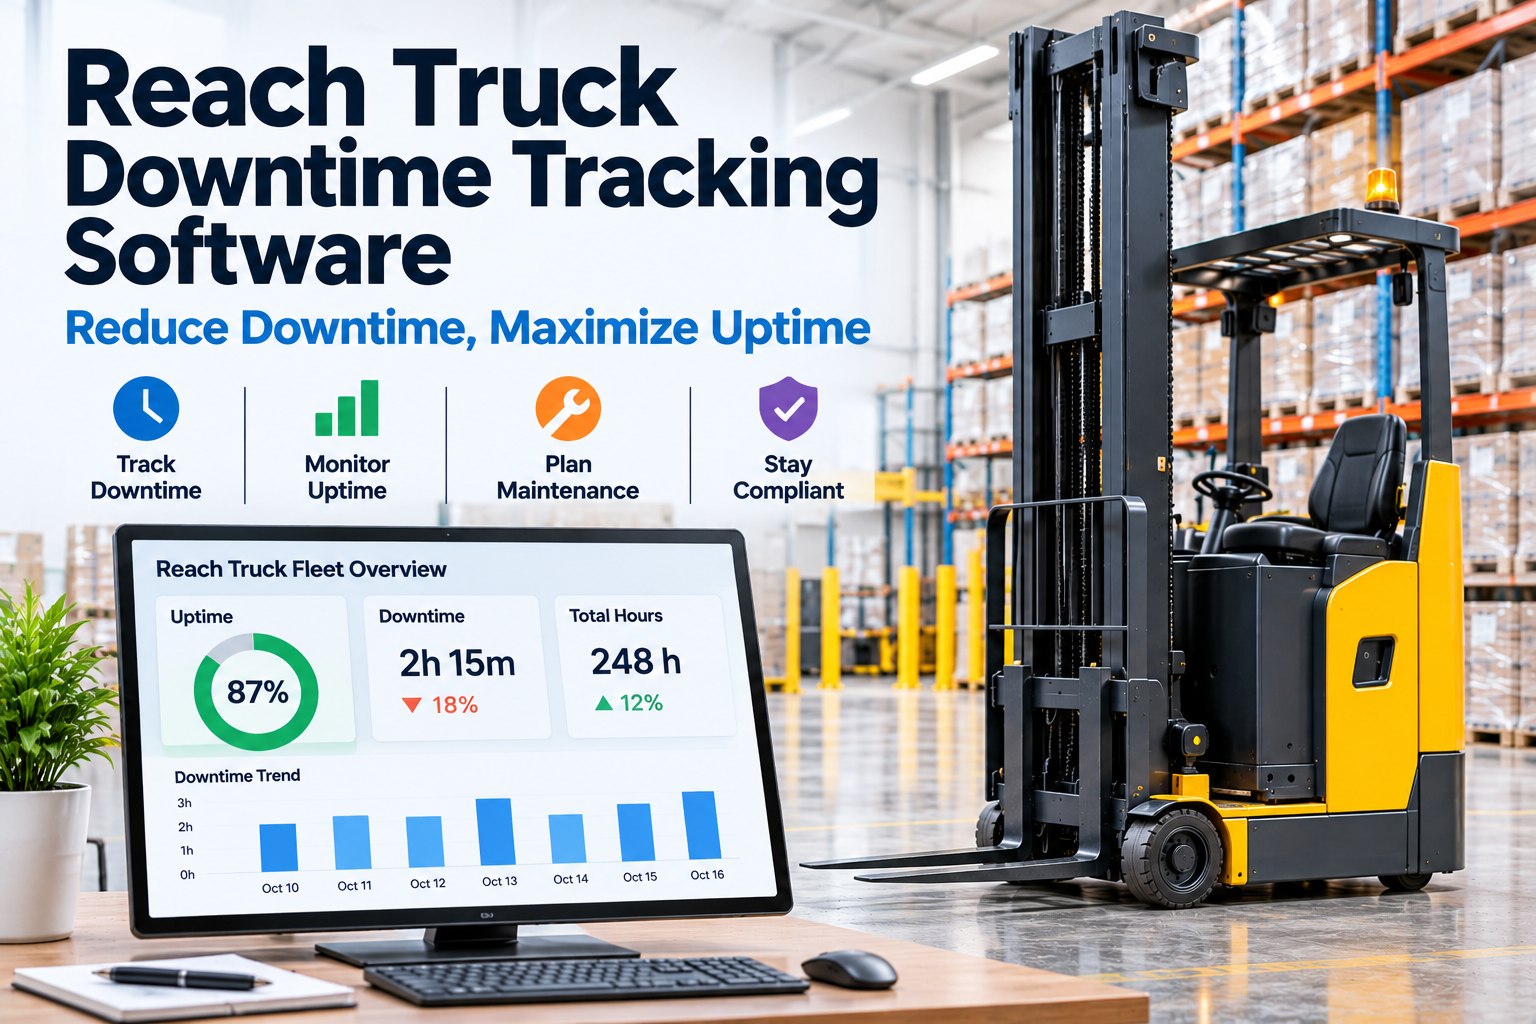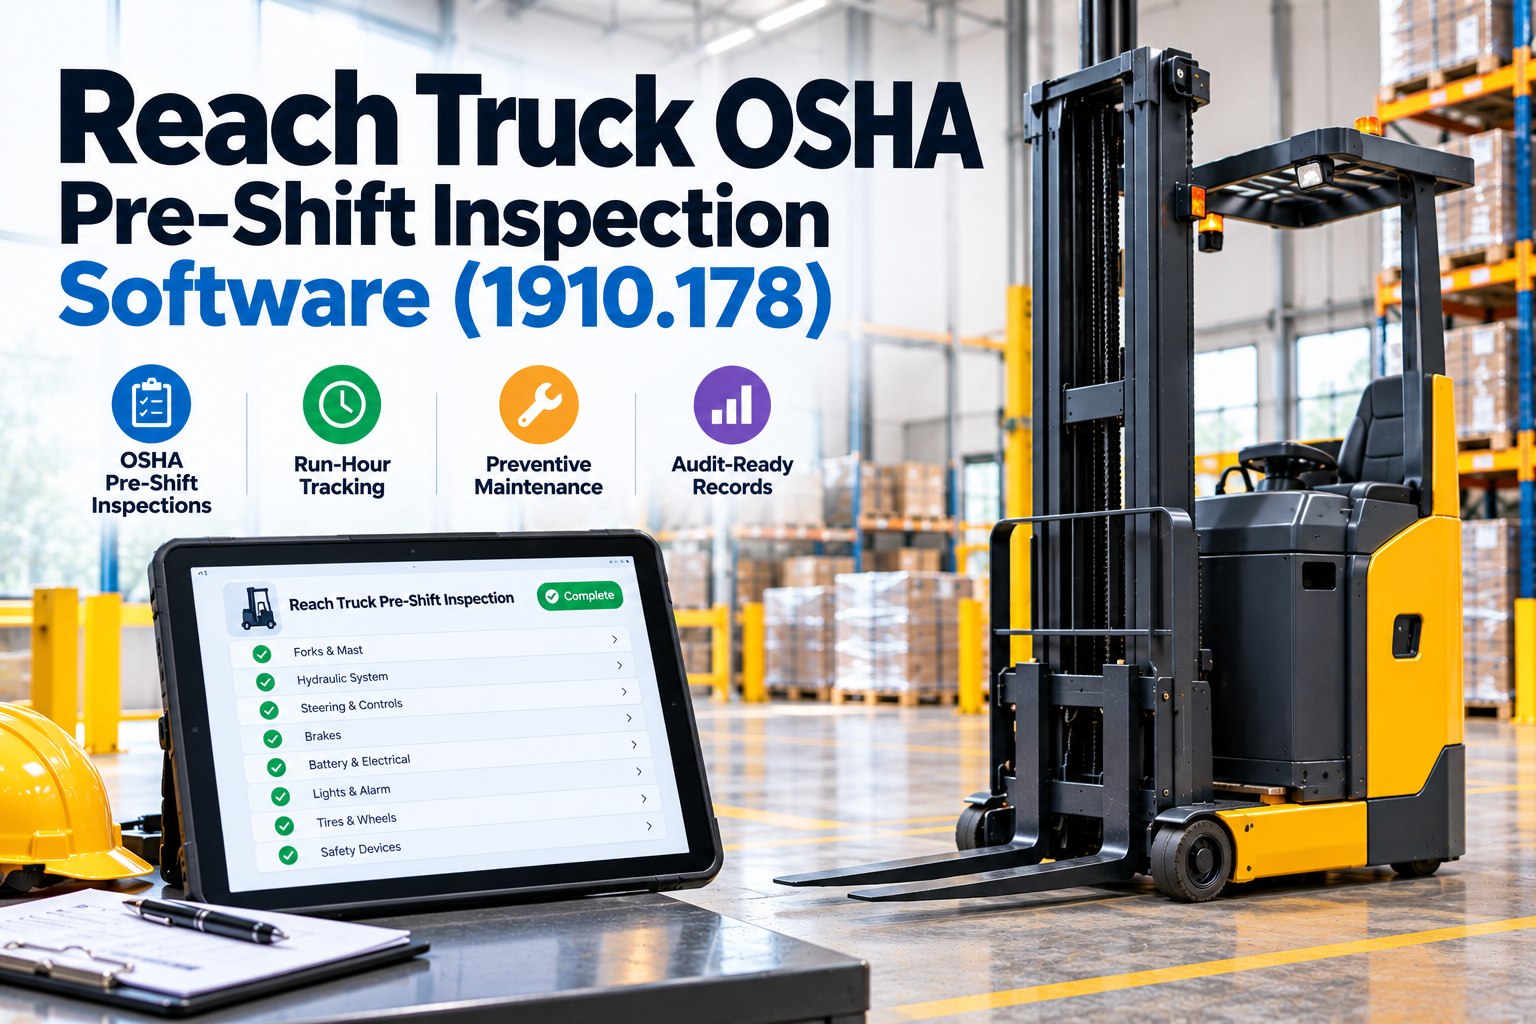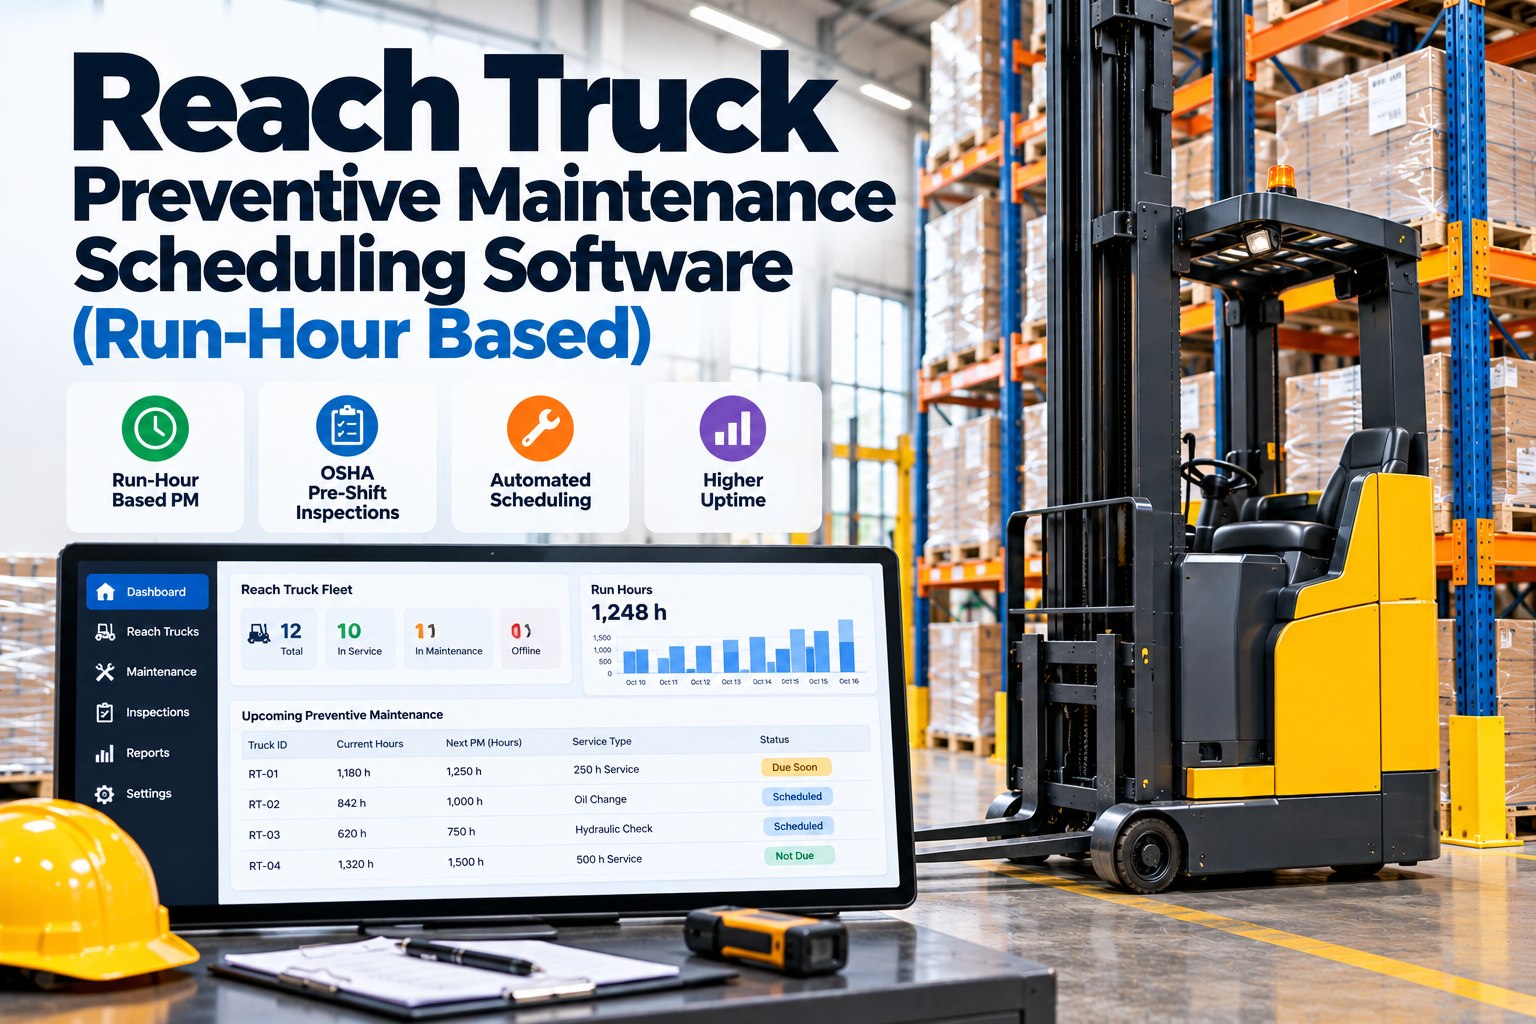
Ask three plant managers in the same manufacturing network how many forklifts are down for maintenance right now, and you will likely get three different answers, three different spreadsheets, and no way to compare them side by side. That fragmentation is the real cost of growing a manufacturing footprint without a shared fleet system, and it only gets more expensive as the site count climbs. The best forklift fleet software for multi-plant manufacturers in 2026 is not just a bigger version of single-site software, it is built from the ground up to give corporate operations one standardized view across every plant while still letting local teams run their own floor. This guide walks through what actually separates enterprise-ready fleet software from single-site tools, how the leading approaches compare, and how a network rolls out a standardized system without a two-year IT project. You can sign up for a free trial to see your first plant's fleet in one dashboard, or book a demo to map out a network-wide rollout with a specialist.
The best forklift fleet software for multi-plant manufacturers standardizes preventive maintenance schedules, inspection records, and KPI reporting across every site from one corporate dashboard, while still giving each plant local control over daily operations. FleetRabbit is built for this model, pushing consistent maintenance and inspection standards network-wide and rolling data up into a single view for operations leadership, without forcing every plant to run identically.
Why Single-Site Fleet Tools Break Down Across a Network
Most fleet tracking starts small. One plant adopts a spreadsheet or a manufacturer's own telematics box, it works well enough, and the next plant copies the idea with a slightly different version. Multiply that across five, ten, or twenty sites and corporate operations ends up with a patchwork of tools that were never designed to talk to each other. Leadership sees network performance weeks late, compiled manually from reports that do not share a common structure, and a maintenance improvement discovered at one plant almost never reaches the others in any formal way.
What Enterprise-Grade Fleet Software Actually Needs
Feature lists rarely reveal whether a platform can actually govern a network of plants. The real test is whether corporate operations can push a standardized maintenance schedule to every site at once, or whether someone has to update each location's settings by hand. Enterprise-ready fleet software is built around three layers of access that work together instead of competing for control.
Corporate Layer: Network-Wide Standards
Corporate operations sets the maintenance intervals, inspection checklists, and safety rules that apply everywhere, then pushes updates to the entire network at once instead of visiting each plant's settings individually. This is what turns twenty separately run plants into one comparable operation.
Regional Layer: Grouped Oversight
Regional managers overseeing a cluster of plants need a view scoped to their sites specifically, with the ability to compare performance across their region without wading through data from plants they do not manage.
Plant Layer: Local Operational Control
Local supervisors still need to run their own floor day to day, assigning operators, scheduling shift-based inspections, and responding to issues in real time, without corporate standards getting in the way of how their specific plant actually operates.
Role-Based Access Matters More Than It Sounds
When access is not scoped correctly, plants either see too much irrelevant data or too little to act on. Getting this layering right is often the single biggest factor in whether a network-wide rollout actually gets adopted by plant teams instead of quietly ignored.
FleetRabbit gives corporate teams a single view across every site while plant supervisors keep full local control. Sign up to connect your first plant, or book a demo to plan a network-wide rollout with a specialist.
Comparing Approaches to Multi-Plant Fleet Software
Multi-plant manufacturers generally choose from four approaches, and the right one depends heavily on network size and how standardized operations already are.
| Approach | Governance Model | Best Fit | Limitation at Scale |
|---|---|---|---|
| Per-plant spreadsheets | None, each site manages its own | Single-site operations only | No network visibility, no shared standards |
| OEM telematics per brand | Standardized only within one truck brand | Networks running one forklift brand everywhere | Breaks down once any plant runs a different brand |
| Enterprise EAM platforms | Strong governance, heavy IT lift | 100+ site global conglomerates with dedicated IT teams | Multi-year rollout timelines and high implementation cost |
| FleetRabbit | Corporate, regional, and plant tiers in one platform | Mid-to-large manufacturers with 5 to 100+ sites | Best value once each plant's fleet data is onboarded |
Rolling Out Standardized Fleet Software Across a Network
Standardizing fleet operations across multiple plants does not require forcing every site to run identically. It means aligning the things that should be comparable across the network, so performance data means the same thing everywhere and improvements can travel from one plant to the rest.
Map Each Site's Current State
Document how each plant currently defines uptime, tracks maintenance, and records inspections today, gaps included. This baseline shows exactly how far apart the network actually is before any standard gets proposed.
Agree on a Network-Wide KPI Dictionary
Get every site to adopt the same definitions for uptime, cost-per-hour, and inspection compliance, so a number from Plant A means exactly what the same number means at Plant B.
Pilot at a Small Group of Sites
Roll the standard out to two or three plants first, work out the friction points with real operators and supervisors, and use that feedback before pushing it network-wide.
Expand Network-Wide With Corporate Oversight
Once the pilot proves out, corporate operations can push the same maintenance schedules, inspection checklists, and access rules to the rest of the network from one dashboard, with regional and plant teams already familiar with how the system works.
Benchmarking KPIs Across the Network
Once standardized, a handful of metrics tell corporate operations exactly where the network stands. Fleet uptime percentage becomes directly comparable across every plant for the first time, revealing which sites are quietly underperforming instead of hiding behind their own reporting format. Planned versus unplanned maintenance ratio flags which plants are still running reactive maintenance long after the rest of the network moved to a preventive schedule.
Cost Per Operating Hour by Site
Comparing cost per operating hour across plants running the same equipment class often reveals surprising gaps, usually traced back to one site still relying on emergency repairs that another site eliminated months earlier through preventive scheduling.
Frequently Asked Questions
Growing from one plant to a network of them exposes every shortcut that worked fine at a single site but breaks down the moment leadership needs to compare performance across locations. The manufacturers getting ahead of this in 2026 are not forcing every plant to look identical, they are standardizing the handful of things that actually need to match, uptime definitions, maintenance schedules, and inspection records, while leaving each site free to run its own floor. FleetRabbit was built around that exact balance, and most networks can pilot it at a few sites and see the difference before committing to a full rollout.
Stop compiling network performance from spreadsheets that don't match. FleetRabbit standardizes maintenance schedules, inspections, and reporting across every plant while keeping local teams in control. Start your free trial today with no credit card required.