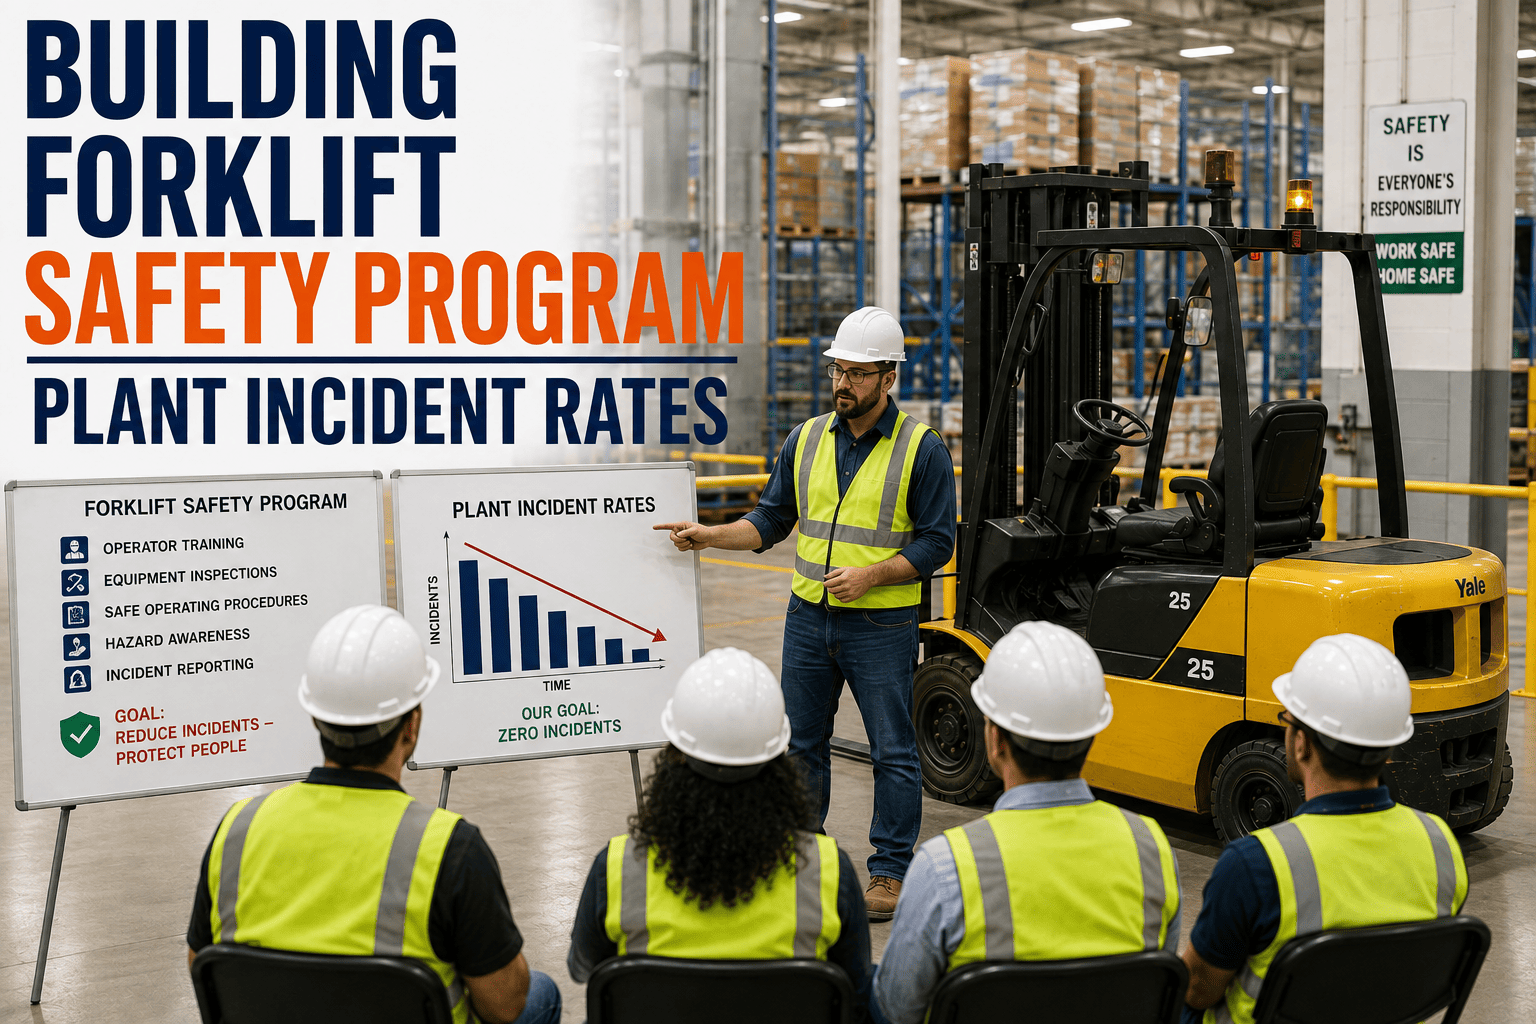
Most plants already have a forklift safety program on paper. There is a binder of policies, a poster in the break room, and a training class new hires sit through once. Yet incident rates barely move year over year, because a program built on signage and a single onboarding session is not actually managing risk, it is just documenting intent. A safety program that moves the needle looks completely different: it runs on data, catches near-misses before they become injuries, and holds operators accountable through ongoing evaluation rather than a certificate that gets filed away and forgotten.
Roughly 70 percent of forklift accidents trace back to operator error, and OSHA-compliant, well-structured training programs can cut incident rates from about 12 per 100 operators down to 3.6. Powered industrial truck violations generated over 8 million dollars in OSHA penalties in a recent enforcement year, with manufacturing leading every sector in citations. A program built on inspection data, near-miss reporting, and recurring evaluation is what actually closes that gap.
Why Most Safety Programs Stall Out
The gap between a documented policy and a working safety culture usually comes down to where operator error actually originates. When incidents are broken down by root cause, a clear pattern emerges, and it is not random bad luck.
Share of operator-error incidents by root cause, based on recent industry safety data. Together these four causes account for the large majority of preventable accidents.
The Cost of Waiting for an Incident to Happen
A single serious forklift accident, once medical costs, downtime, equipment damage, and liability are combined, can exceed 200,000 dollars in total financial impact. That figure alone makes prevention the more affordable path, long before OSHA penalties or insurance premiums are even factored in.
FleetRabbit turns inspection logs, near-miss reports, and operator history into a single risk picture for your plant. Sign up for free and start tracking the patterns that lead to accidents.
Five Pillars of a Program That Actually Reduces Incidents
Plants that see real reductions in incident rates build their program around five connected pillars rather than a single training event. Each pillar reinforces the others, so a gap in one area does not quietly undermine the rest of the program.
Structured Operator Training
Formal instruction paired with hands-on evaluation, not a video and a quiz. Site-specific hazards get covered, not generic content.
Daily Equipment Inspection
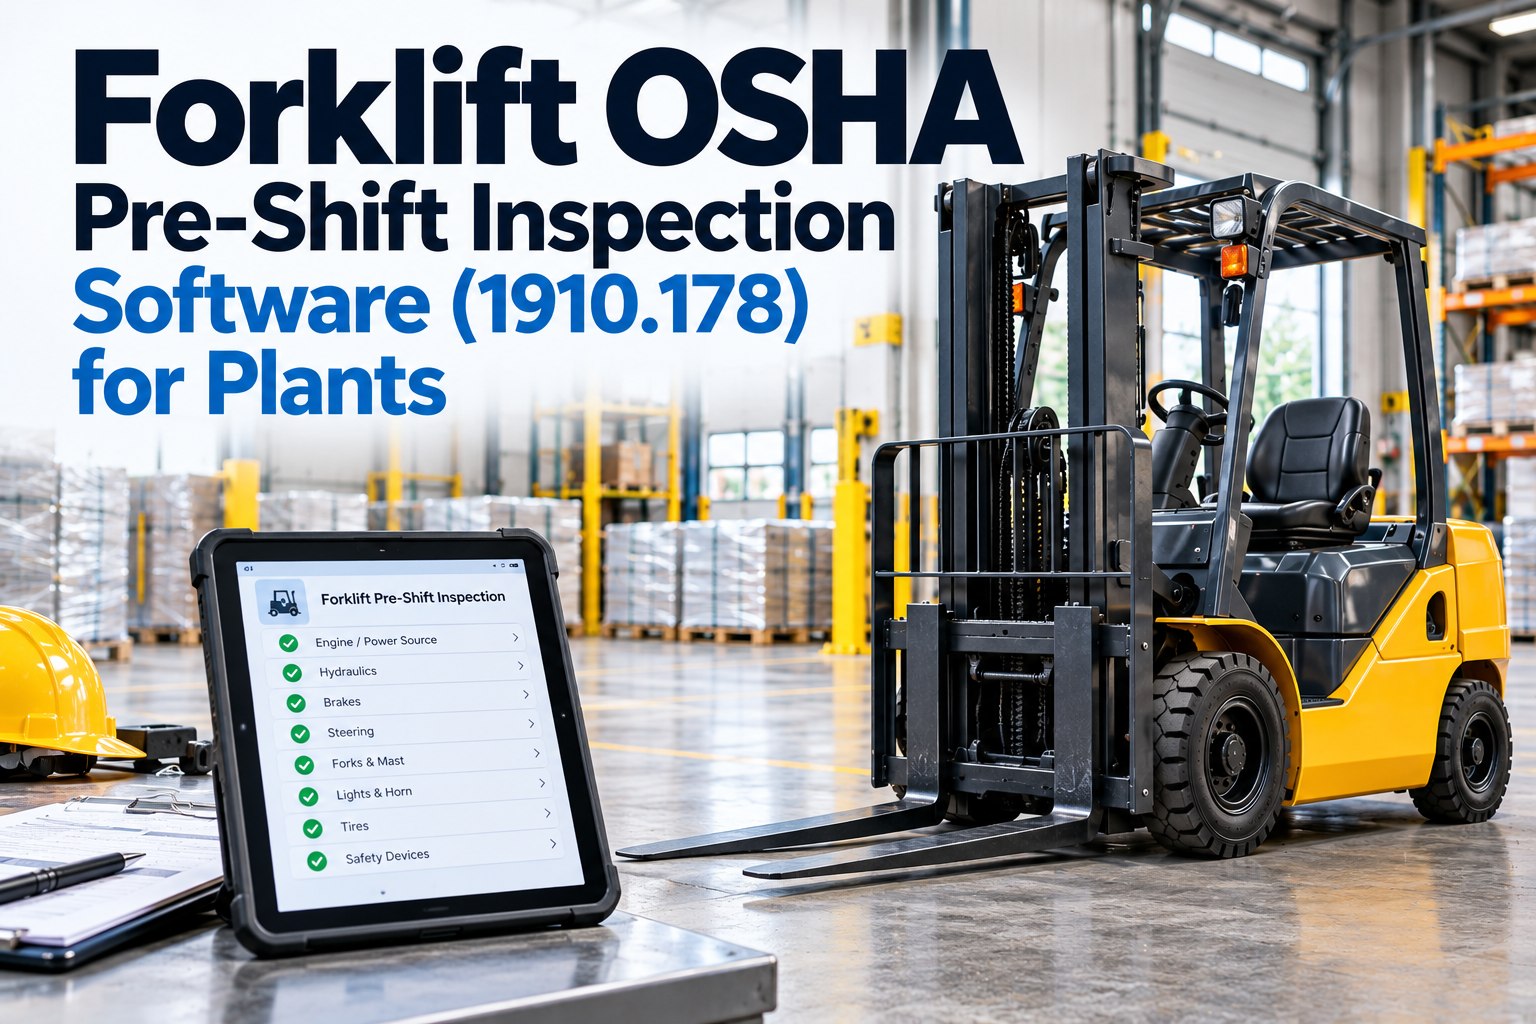
Pre-shift checks catch mechanical issues before they cause a tip-over or brake failure on the floor.
Near-Miss Reporting
A near-miss logged today is an accident prevented tomorrow. Programs that track near-misses catch patterns before injuries occur.
Pedestrian and Traffic Separation
Marked lanes, mirrors, and clear crossing zones reduce collision risk, which remains a leading cause of serious plant injuries.
Recurring Evaluation
Operators are reassessed on a set schedule, not just after an incident, keeping skills sharp and habits from drifting.
Leading Indicators vs. Lagging Indicators
Safety programs that only measure injuries are always looking backward. The plants that consistently lower their incident rate track leading indicators, the signals that show up before an accident happens, alongside the lagging indicators everyone already reports.
| Indicator Type | What It Measures | Example Metric | Why It Matters |
|---|---|---|---|
| Leading Indicators | Behaviors and conditions that predict future risk | Near-miss reports filed, pre-shift inspection completion rate | Gives supervisors time to intervene before an injury occurs |
| Lagging Indicators | Outcomes after an incident has already happened | Recordable injuries, lost workdays, OSHA citations | Confirms whether the program is working, but too late to prevent that incident |
| Training Health | Whether certifications and evaluations stay current | Percentage of operators within their three-year evaluation window | Lapsed certifications are a top driver of both incidents and citations |
| Equipment Health | Mechanical condition across the active fleet | Percentage of trucks with an open, unresolved defect | Poorly maintained equipment contributes to a large share of preventable failures |
What Consistent Tracking Delivers
Programs that track leading indicators alongside lagging ones typically catch developing problems weeks before an incident report would ever surface them. That head start is the entire difference between a plant that reacts to accidents and one that prevents them. Book a demo to see how FleetRabbit surfaces these indicators automatically from data your plant is already collecting.
What Getting It Right Looks Like
The numbers below reflect what structured, data-driven safety programs achieve compared to plants still running on paper checklists and annual training sessions.
FleetRabbit connects operator certification status, daily inspection results, and incident reports so your safety team can see risk building before it becomes a claim. Start your free trial today, no credit card required.
Frequently Asked Questions
Stop relying on annual training and a binder of policies. FleetRabbit connects training, inspections, and near-miss data so your plant can catch risk before it becomes an injury.