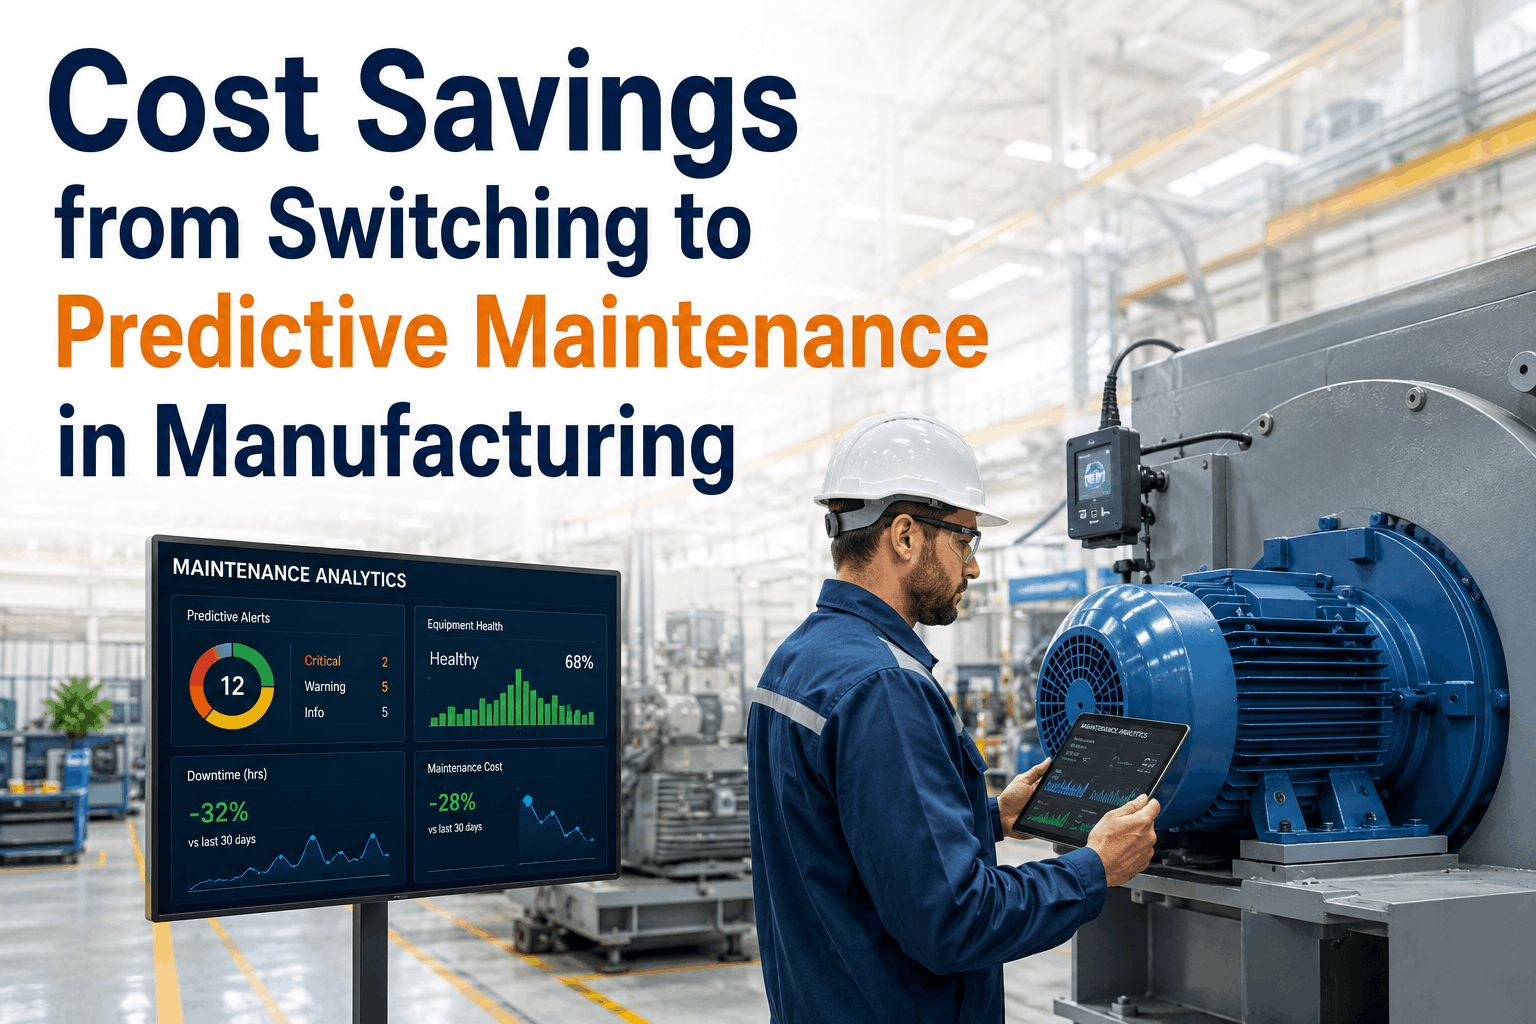
Cost Savings from Switching to Predictive Maintenance in Manufacturing
Manufacturing facilities running scheduled maintenance programmes are paying for two categories of work they don't need: service intervals that fire too early, before equipment has consumed its useful maintenance window, and emergency repairs that arrive too late, after an avoidable failure has already halted production. That structural inefficiency — the gap between when maintenance happens and when equipment actually requires it — is where the largest recoverable cost pool in most industrial operations sits untapped. Predictive maintenance closes that gap by replacing calendar-based or hour-threshold-based service triggers with condition signals drawn directly from the equipment itself: vibration pattern changes, temperature trend deviations, fluid contamination levels, and operational load signatures that indicate developing faults days or weeks before they escalate into failures. Fleet Rabbit's condition-based maintenance intelligence platform was built specifically for manufacturing forklift fleets and heavy industrial equipment — converting raw telemetry into actionable maintenance decisions that reduce unplanned downtime, extend equipment lifecycle, and generate documented cost savings that finance teams can present to leadership. Explore Fleet Rabbit's predictive maintenance platform with a free account or book a live predictive maintenance demo with our team.
The True Cost of Reactive and Scheduled Maintenance in Manufacturing
Most manufacturing operations understand that reactive maintenance — fixing equipment after it fails — is expensive. Fewer recognise that scheduled preventive maintenance, the supposed upgrade from reactive repair, carries its own category of hidden cost: over-maintenance of equipment that isn't yet ready for service, missed developing faults that fall between scheduled inspection windows, and the administrative burden of managing calendar-based PM programmes across fleets of dozens or hundreds of industrial assets. Predictive maintenance replaces both of these inefficient models with a continuous condition signal that tells maintenance teams exactly what each machine needs and when it needs it — no more, no less. Fleet Rabbit's industrial IoT maintenance platform delivers that signal for manufacturing forklift fleets and heavy plant equipment, with the analytics layer that translates raw sensor data into specific maintenance actions that reduce cost and protect uptime.
The Maintenance Cost Problem
Reactive Maintenance
3–5×
higher cost per repair event vs. planned maintenance — plus unquantified production downtime losses
Scheduled Preventive
30–40%
of scheduled PM work performed on equipment that doesn't yet require service — wasted labour and parts spend
Predictive (Condition-Based)
25–35%
total maintenance cost reduction vs. scheduled PM — with 70–75% fewer unplanned failures
Fleet Rabbit Platform Impact
$4,200
Avg. annual per-machine cost saving vs. scheduled PM baseline
71%
Reduction in unplanned downtime events within 6 months of deployment
2.3×
Equipment lifecycle extension for assets under Fleet Rabbit condition monitoring
18 days
Average fault detection lead time before failure — intervention window that reactive programmes never have
See Fleet Rabbit's predictive maintenance ROI applied to your fleet. Our manufacturing maintenance specialists will model the cost savings for your specific equipment mix and maintenance baseline.
Where Predictive Maintenance Generates Cost Savings: Six Proven Mechanisms
Predictive maintenance cost savings in manufacturing are not a single line item — they compound across six distinct cost categories, each of which represents a recoverable budget pool that reactive and scheduled maintenance programmes leave on the table. Fleet Rabbit's condition-based monitoring platform captures savings across all six simultaneously, which is why the ROI of industrial IoT maintenance consistently outperforms the projections of teams that model only the most obvious savings category.
01
Unplanned Downtime Elimination
Highest Impact
Unplanned equipment failures in manufacturing environments cost between $3,000 and $28,000 per hour in combined repair cost, lost production, and downstream disruption — depending on where the failed asset sits in the production flow. Fleet Rabbit's condition monitoring detects the fault signatures that precede failures by an average of 18 days, enabling planned maintenance interventions during scheduled windows rather than emergency repairs during production hours. The financial delta between a planned two-hour maintenance window and an unplanned six-hour production stoppage is not a maintenance cost — it is a production revenue protection figure, and it is the largest single component of predictive maintenance ROI for most manufacturing facilities.
$3K–$28KPer hour of unplanned manufacturing downtime
71%Unplanned failure reduction with Fleet Rabbit monitoring
18 daysAvg. fault detection lead time before failure event
02
Parts and Labour Cost Optimisation
Cost Savings
Scheduled maintenance programmes replace parts on calendar intervals regardless of actual wear state — hydraulic filters changed at 250 hours regardless of contamination level, brake components replaced at 1,000 hours regardless of measured pad thickness, belts swapped at six-month intervals regardless of tension and wear signature. Predictive maintenance replaces parts when condition monitoring indicates they are approaching the end of their effective service window — not before, not after. Fleet Rabbit's condition monitoring data shows that parts replaced on condition-based triggers average 34% more service life delivered before replacement compared to calendar-interval replacements. Across a 20-vehicle forklift fleet, that differential translates to $60,000–$120,000 in annual parts spend reduction without any reduction in equipment reliability.
34%More service life delivered per part vs. calendar-interval replacement
$60K–$120KAnnual parts savings for a 20-vehicle forklift fleet
03
Equipment Lifecycle Extension
Capital ROI
Heavy industrial equipment — forklifts, reach trucks, and manufacturing plant machinery — depreciated over 7–10 year capital schedules actually delivers useful productive service for 12–18 years when maintained to condition rather than calendar. The compound effect of catching developing faults early, before secondary damage propagates to adjacent systems, dramatically extends the interval between major overhauls and pushes replacement decisions years further than scheduled PM programmes achieve. Fleet Rabbit's condition monitoring clients report average lifecycle extensions of 2.3× for assets under continuous condition surveillance — a capital deferral value that finance teams can quantify directly against the acquisition cost of replacement equipment when building the predictive maintenance business case.
2.3×Lifecycle extension for Fleet Rabbit-monitored heavy equipment
$45K+Capital deferral value per forklift at replacement-delay point
04
Maintenance Labour Efficiency
Operational ROI
Scheduled PM programmes generate a fixed volume of maintenance work orders regardless of actual equipment condition — consuming technician hours on routine inspections that confirm equipment needs nothing, and on parts replacements that could have waited. Predictive maintenance concentrates labour on work that genuinely needs doing: targeted interventions on the specific systems that condition monitoring has flagged, with diagnostic context that lets technicians prepare the correct parts before arriving at the machine. Fleet Rabbit's work order intelligence reduces average repair time per event by 28% — because technicians arrive knowing what fault they are addressing, having pre-staged the required components, rather than diagnosing and sourcing parts after opening the machine.
28%Repair time reduction per event with pre-diagnosed work orders
40%Reduction in routine inspection labour hours vs. scheduled PM
05
Energy and Fuel Cost Reduction
Efficiency Gains
Degrading equipment runs less efficiently — consuming more fuel or electrical energy per unit of productive work output as components wear beyond their optimal operating envelope. A forklift hydraulic system with contaminated fluid and worn pump seals draws 15–22% more energy per lift cycle than the same machine in calibrated condition. Fleet Rabbit's condition monitoring detects these efficiency degradation signatures — elevated current draw on electric forklifts, increased fuel consumption on IC trucks, pressure anomalies in hydraulic circuits — and triggers corrective maintenance before inefficiency compounds across thousands of operating cycles. Energy efficiency restoration through condition-triggered maintenance generates an ongoing operational cost reduction that continues for the full remaining operating life of the asset.
15–22%Energy overconsumption in degraded equipment vs. maintained baseline
12%Average fleet fuel and energy cost reduction post-deployment
06
Insurance and Compliance Cost Reduction
Risk ROI
Industrial equipment operated in deteriorating mechanical condition generates elevated risk profiles for insurers and regulatory bodies — higher accident probability, higher severity when incidents occur, and higher scrutiny under OSHA inspection of maintenance programme adequacy. Fleet Rabbit's condition monitoring produces a continuous, auditable maintenance record that documents proactive fault detection and corrective action — the evidence base that insurance underwriters reward with premium reductions and that OSHA inspectors recognise as a programme that takes equipment safety seriously. Documented predictive maintenance programmes have supported commercial insurance premium reductions of 8–14% for manufacturing fleets, and have been cited by OSHA compliance officers as a significant mitigating factor in penalty assessment following equipment incidents.
8–14%Commercial insurance premium reduction with documented predictive programme
100%Auditable maintenance history per asset — OSHA and insurer ready
Get a predictive maintenance ROI model for your specific fleet. Fleet Rabbit's manufacturing team will calculate your recoverable cost pool across all six savings mechanisms using your actual fleet size, equipment age, and maintenance baseline data.
Predictive vs. Scheduled vs. Reactive: Full Cost Comparison
The financial case for switching from scheduled preventive or reactive maintenance to predictive condition-based monitoring is most clearly understood through a direct cost comparison across maintenance strategy types. The table below reflects actual cost data from Fleet Rabbit manufacturing fleet customers — not modelled projections — across four key cost categories for a representative 20-vehicle industrial forklift fleet operating two-shift, five-day-per-week production schedules.
Cost Category
Reactive Maintenance
Scheduled PM
Predictive (Fleet Rabbit)
Annual Parts Spend (20 vehicles)
$148,000
$112,000
$74,000
Annual Labour Hours (maintenance)
3,840 hrs
2,960 hrs
1,740 hrs
Unplanned Downtime Events (annual)
62 events
31 events
9 events
Avg. Asset Lifecycle
6.2 years
8.4 years
14.1 years
Production Hours Lost (downtime)
496 hrs
248 hrs
72 hrs
Total Annual Maintenance Cost
$386,000
$241,000
$128,000
Savings vs. Reactive:Scheduled PM saves $145K/yr→Fleet Rabbit saves $258K/yr
Fleet Rabbit Predictive Maintenance Platform: Full Capability Overview
Fleet Rabbit's condition-based maintenance intelligence platform delivers predictive maintenance capabilities across every critical system of manufacturing forklift fleets and heavy industrial equipment — from powertrain health monitoring to hydraulic system condition tracking to battery state-of-health analytics for electric vehicle fleets. Each monitoring capability is connected to an intelligent work order engine that converts condition signals into maintenance actions with the right timing, the right parts pre-staged, and the right technician assigned before the fault escalates.
Powertrain Condition Monitoring
Engine oil degradation tracking, transmission temperature trend analysis, drivetrain vibration signature monitoring — detecting developing faults in the systems that account for the majority of catastrophic failure events in IC and diesel forklift fleets. Fault signatures are detected an average of 14–22 days before failure manifestation.
Oil AnalysisVibration MonitoringTemp Trending
Battery State-of-Health Analytics
Electric forklift and reach truck battery capacity tracking, charge cycle efficiency trending, and cell-level voltage deviation detection identify batteries approaching end-of-service-life weeks before performance degradation affects operator productivity or triggers unplanned vehicle grounding during production shifts.
Capacity TrackingCycle EfficiencyCell Monitoring
Hydraulic System Condition Tracking
Hydraulic fluid contamination monitoring, pump pressure cycle analysis, and mast cylinder seal integrity tracking detect the gradual degradation patterns in forklift hydraulic systems that precede lift capacity loss, leak events, and complete system failures — the most common cause of unplanned forklift grounding in high-cycle manufacturing environments.
Fluid ConditionPressure AnalysisSeal Integrity
Tyre and Undercarriage Wear Intelligence
Load-weighted wear rate modelling, surface condition correlation, and impact event accumulation tracking predict tyre replacement requirements and undercarriage service needs per vehicle — replacing visual inspection schedules with data-driven service timing that eliminates blowout risk and cushion tyre wear-through events that damage production floor surfaces.
Condition fault signals automatically generate pre-populated work orders — fault description, affected system, recommended corrective action, and required parts list — routed to the correct technician with the lead time needed to stage components before the maintenance window. Technicians arrive prepared, not diagnosing. Repair times drop. First-time fix rates rise.
Auto Work OrdersParts Pre-StagingTech Routing
Maintenance ROI and Cost Analytics
Fleet-wide maintenance cost dashboards track parts spend, labour hours, downtime events, and total cost-per-operating-hour per vehicle — enabling finance teams to quantify the predictive maintenance ROI in real time and benchmark cost performance against the pre-deployment baseline. Monthly ROI reports are exportable in formats designed for leadership and board-level presentation without manual data assembly.
Cost-per-HourROI TrackingBoard Reports
"
We run 34 forklifts across two production shifts in an automotive components facility. Before Fleet Rabbit, our maintenance strategy was purely calendar-based — PM every 250 hours per vehicle, reactive repairs for everything that fell between intervals. We were averaging 28 unplanned downtime events per year, at an estimated production impact of $4,200 per event. That's $117,600 annually in downtime cost alone, before we counted emergency repair labour and expedited parts. After 12 months on Fleet Rabbit's predictive monitoring platform, we had 6 unplanned events — a 79% reduction. Total maintenance cost including the platform subscription was $94,000 lower than our prior-year baseline. The system paid for itself in 47 days. The number our finance director still asks me about is the lifecycle extension projection — Fleet Rabbit's data suggests we can defer replacement of our four oldest machines by an average of 3.1 years each, which represents $186,000 in capital expenditure that stays in the budget.
— Maintenance Manager, Automotive Components Manufacturer — 34 Forklifts — 2-Shift Production — Fleet Rabbit Predictive Monitoring Active
Implementation Pathway: From Scheduled PM to Predictive Maintenance
Transitioning a manufacturing facility's maintenance strategy from calendar-based scheduling to condition-based monitoring does not require replacing existing CMMS infrastructure, retraining an entire maintenance team simultaneously, or taking vehicles out of service for extended sensor installation periods. Fleet Rabbit's phased implementation pathway delivers the first condition monitoring data within days of hardware installation and progressively deepens predictive intelligence as the platform's baseline dataset for each asset matures.
1
Fleet Assessment & Sensor Specification
Days 1–5
Fleet Rabbit's manufacturing maintenance specialists conduct a vehicle-by-vehicle assessment — documenting existing maintenance history, identifying highest-risk assets, and specifying the sensor configuration appropriate for each vehicle class and operating environment. No hardware is ordered before the assessment confirms the optimal monitoring architecture for your fleet.
2
Hardware Installation & Baseline Data Collection
Days 6–18
Condition monitoring sensors are installed across the fleet — 60–90 minutes per vehicle, no production interruption required. The platform begins capturing operating condition data immediately. During the baseline period, Fleet Rabbit establishes the normal operating signature for each asset — the reference envelope against which developing fault deviations are subsequently detected.
3
Threshold Configuration & Alert Protocol Setup
Days 19–25
Fault detection thresholds are configured per vehicle class and operating environment — calibrated to your facility's production intensity, shift patterns, and load cycles rather than generic manufacturer defaults. Alert escalation protocols are designed around your maintenance team's structure: which faults route to which technicians, at what lead times, with what urgency classification.
4
Live Predictive Intelligence & Continuous ROI Tracking
Day 26 onwards
The full predictive maintenance intelligence layer is active — condition fault alerts generating pre-populated work orders, cost analytics tracking maintenance spend against the pre-deployment baseline, and the ROI dashboard accumulating the documented savings evidence that finance teams need to validate the business case. Most facilities capture their first predicted-and-prevented failure within 30 days of full deployment.
Predictive Maintenance ROI
Stop Paying for Maintenance You Don't Need.
Stop Absorbing Failures You Could Have Prevented.
Fleet Rabbit's condition-based monitoring platform gives manufacturing facilities the real-time equipment health intelligence to eliminate unplanned downtime, optimise parts and labour spend, extend asset lifecycle, and document predictive maintenance ROI — all from a single platform that installs in days and delivers measurable savings within the first operating month.
$258KAvg. annual savings vs. reactive baseline (20-vehicle fleet)
71%Unplanned failure reduction within 6 months
47 daysAvg. payback period — platform cost recovered
Q
How long does it take for Fleet Rabbit's predictive maintenance platform to generate reliable condition alerts for a manufacturing fleet?
Fleet Rabbit begins capturing condition data immediately upon sensor installation — live readings are available from day one. Reliable predictive fault alerts, calibrated to each asset's specific operating baseline, typically activate within 14–21 days of continuous data capture. This baseline period is necessary to distinguish normal operating variation (which differs by machine age, load duty, and facility environment) from the deviation patterns that indicate developing faults. During the baseline period, the platform operates in condition monitoring mode — providing real-time equipment health visibility without generating false-positive fault alerts. Most facilities receive their first accurately predicted fault notification within the first 30 days of full deployment.
Q
Can Fleet Rabbit's predictive maintenance platform integrate with our existing CMMS or ERP system?
Fleet Rabbit supports API-based integration with major Computerised Maintenance Management Systems and ERP platforms — including SAP PM, IBM Maximo, Infor EAM, and Oracle Asset Management. Condition fault alerts and automatically generated work orders can flow directly into your existing CMMS workflow, ensuring that predictive maintenance actions are managed within the same system your technicians already use rather than creating a parallel work order process. Asset cost data, parts consumption records, and maintenance history generated by Fleet Rabbit can also flow into ERP financial modules — enabling the maintenance cost analytics that finance teams need for total cost of ownership modelling and capital replacement planning. Schedule a demo to review the integration options available for your specific technology environment.
Q
How does Fleet Rabbit's predictive maintenance platform handle equipment that operates across multiple shifts with different operators and intensity profiles?
Fleet Rabbit's condition monitoring baseline is established per vehicle rather than per operator — capturing each asset's operating signature across all shifts and all operators automatically. The platform identifies shift-level and operator-level intensity patterns that contribute to accelerated wear, flagging assets that are consistently operated at higher intensity on specific shifts or by specific operators — enabling maintenance interval adjustment that reflects actual load duty rather than assumed uniform operating conditions. Multi-shift industrial facilities typically see the highest predictive maintenance value from Fleet Rabbit's monitoring platform, because the intensity variation between shifts creates the early degradation signals that single-shift or low-utilisation equipment generates more slowly.
Q
What is the realistic ROI timeline for switching a 15–30 vehicle manufacturing fleet from scheduled PM to Fleet Rabbit predictive monitoring?
For a 15–30 vehicle manufacturing forklift fleet operating two-shift production schedules, Fleet Rabbit customers consistently report platform cost recovery within 45–75 days of full deployment — driven primarily by the elimination of the first one or two unplanned downtime events that predictive fault detection prevents. Full-year ROI, including parts optimisation savings, labour efficiency gains, and lifecycle extension capital deferral, averages 4.2× the annual platform cost for fleets in this size range. The ROI compounds year-over-year as the platform's historical dataset deepens, improving fault detection accuracy and enabling increasingly precise maintenance interval optimisation. Sign up for a free account to access Fleet Rabbit's ROI modelling tool pre-configured for your fleet size and maintenance baseline.