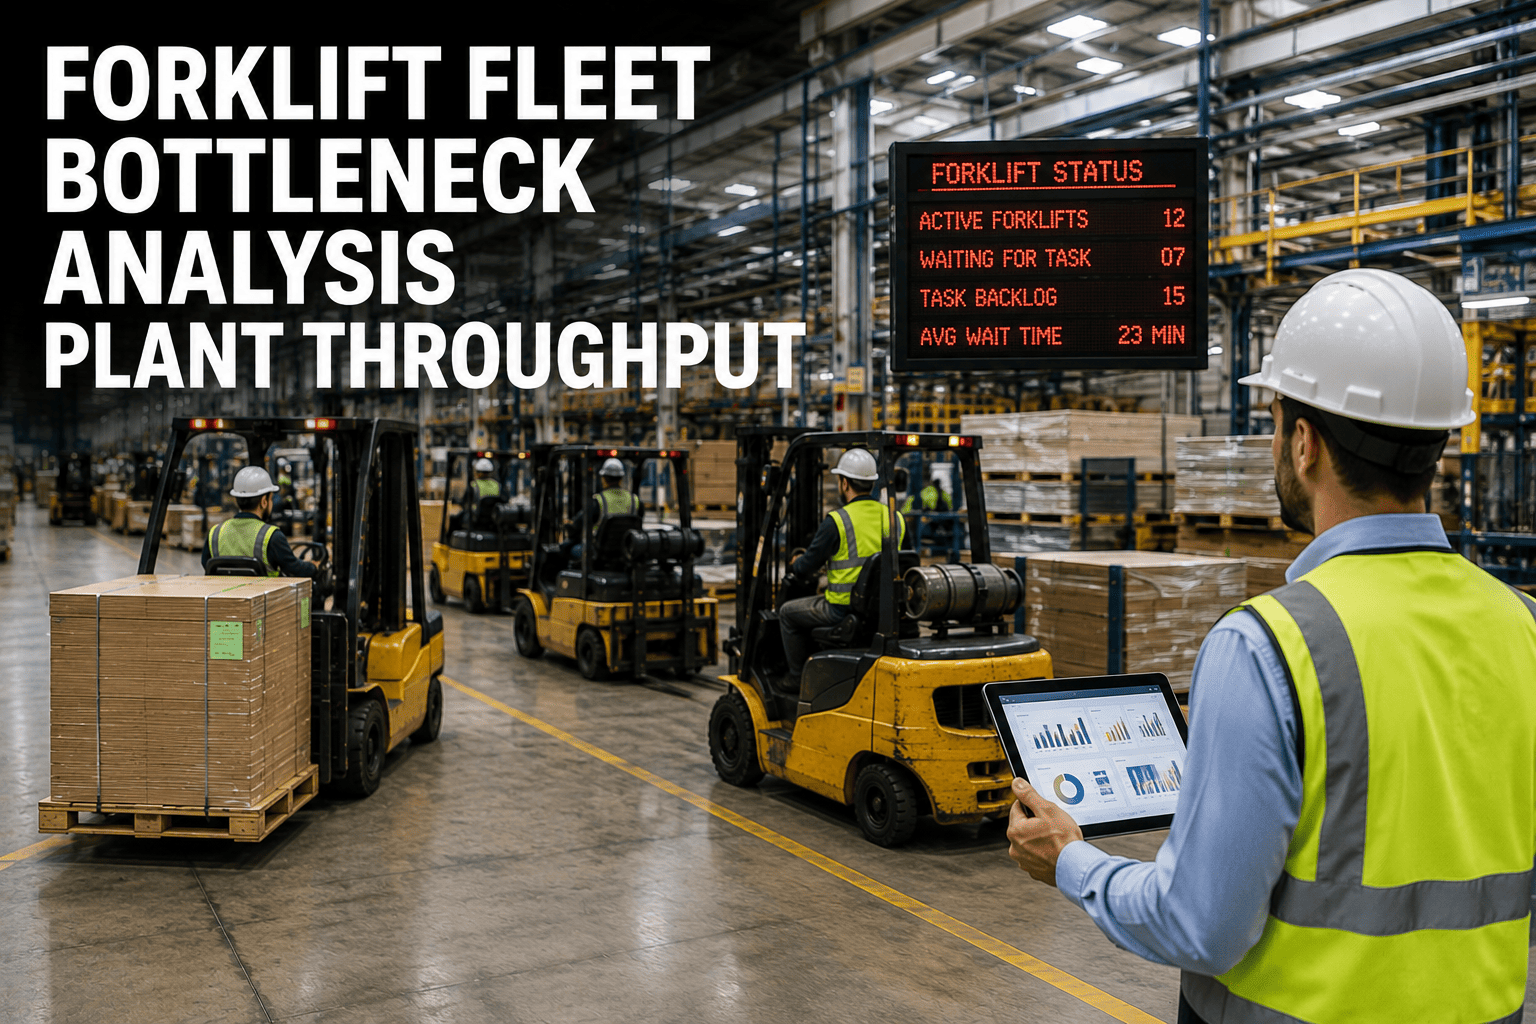
Walk any plant floor for an hour and you'll see it before any report shows it: a forklift waiting at a dock while two pallet lanes sit empty, an operator circling the long way around because the direct aisle is jammed, a staging area that looks calm on the supervisor's shift report but is quietly adding forty minutes to every cycle. None of these moments show up as a single dramatic failure. They show up as throughput that never quite hits target, no matter how many machines you add to the fleet.
A forklift fleet bottleneck is a point in your material flow where equipment, zone, or operator capacity limits total plant output, even when other parts of the fleet run under capacity. Zone-level dwell time, utilization spread across shifts, and queue length at docks are the three signals that expose a bottleneck fastest. Plants that run structured bottleneck analysis typically recover 10 to 20 percent of lost throughput without buying a single additional forklift, simply by rebalancing routes, shifts, and dispatch around the real constraint instead of the assumed one.
What a Forklift Bottleneck Actually Looks Like
A bottleneck is not the forklift that breaks down. It is the forklift, zone, or process step that limits how fast everything else can move, even when it is working perfectly. In most plants, the constraint hides in plain sight: a single dock handling both inbound and outbound freight, a narrow aisle shared by three product lines, or a shift change that leaves a zone unstaffed for twenty minutes at the exact moment demand peaks. You can add three more forklifts to the fleet and throughput barely moves, because the extra machines are competing for the same choke point instead of relieving it.
Three Signals That Point Straight at the Constraint
Dwell Time by Zone
Staging areas that show long average dwell times on one shift but not another reveal exactly where material is waiting instead of moving, and why.
Utilization Spread
When one forklift class runs near full capacity while another idles for hours, the fleet is unbalanced against the actual work, not against headcount.
Queue Length at Docks
Repeated queuing at the same dock or intersection, at the same time of day, is the clearest fingerprint of a structural bottleneck rather than a one-off delay.
FleetRabbit tracks dwell time, utilization, and queue formation zone by zone, so you can pinpoint the actual bottleneck instead of guessing from shift reports. Sign up free and see your plant's flow data within days.
Where Bottlenecks Hide Across a Typical Plant
Material handling accounts for a large share of total manufacturing operating cost in most production environments, and the forklift fleet carrying every input and output across the floor is usually the least measured part of the operation. Bottlenecks tend to cluster in the same handful of locations across most facilities, though the size of the impact varies by layout and shift pattern.
| Bottleneck Location | Typical Warning Sign | Throughput Impact | Fastest Fix |
|---|---|---|---|
| Shared Dock | Inbound and outbound trucks queued at the same window | 15 to 25 percent cycle delay during peak hours | Split dock assignments by flow direction and shift |
| Narrow Aisle Crossings | Multiple product lines converging on one path | Idle time stacking behind slower-moving units | Reroute low-priority moves to off-peak windows |
| Shift Handover Gap | Zone activity drops sharply for 15 to 20 minutes | Compounding backlog that carries into next shift | Stagger handover times across adjacent zones |
| Single-Class Equipment Pool | One forklift type booked solid, others idle nearby | Fleet-wide utilization appears healthy, plant output isn't | Rebalance equipment class assignment by zone demand |
| Staging Overflow | Pallets accumulating faster than they clear | Downstream cells starved despite upstream output | Adjust dispatch priority ahead of the accumulation point |
How to Run a Bottleneck Analysis on Your Own Fleet
You don't need a full consulting engagement to find your constraint. A structured, data-led pass through the floor over one to two weeks is usually enough to isolate it with confidence.
Pull Zone-Level Dwell Time, Not Just Fleet Averages
Fleet-wide utilization numbers hide constraints. Break dwell time down by zone and shift so the pattern behind the average becomes visible.
Overlay Utilization Against Actual Demand
Compare how busy each forklift class is against the volume of work assigned to its zone. A busy machine in a low-demand zone is a routing problem, not a capacity problem.
Track Queue Formation at Fixed Points
Log where and when queues repeatedly form. A queue that appears at the same location every shift is a structural constraint, not a coincidence.
Test One Change at a Time
Adjust dispatch priority, shift stagger, or dock assignment around the suspected constraint, then measure throughput again before making a second change.
Why Guesswork Usually Points to the Wrong Fix
Floor supervisors are often right about where a bottleneck feels worst, but the felt experience and the measured constraint don't always match. A zone that looks chaotic because of visible congestion may not be the true limiting factor if it still clears its backlog by end of shift, while a quiet-looking zone with a slow, steady buildup can be the real ceiling on output. Structured measurement, not visual impression, is what separates a fix that actually moves throughput from one that just moves the congestion somewhere else.
What Changes Once the Real Constraint Is Known
Once a plant identifies its true bottleneck, the fix is frequently a scheduling or routing change rather than new equipment. Reassigning which zone a forklift class serves during peak hours, staggering shift handovers by fifteen minutes, or splitting a shared dock by flow direction can recover meaningful throughput within the same fleet size. Facilities that book a demo with FleetRabbit typically start by mapping exactly these three signals across a single shift before deciding whether the answer is a process change or a fleet expansion.
Fewer Idle Machines
Rebalancing routes around the real constraint reduces machines waiting on work elsewhere in the plant.
Shorter Dock Queues
Splitting shared docks by direction and shift cuts repeated queuing at the busiest crossing points.
Steadier Downstream Flow
Downstream cells stop starving for material when the upstream constraint clears on schedule instead of in bursts.
Frequently Asked Questions
The bottleneck limiting your plant right now is measurable, not mysterious. FleetRabbit turns every forklift movement into zone-level data that shows exactly where material is waiting and why, so your next fix targets the real constraint instead of the loudest complaint.







