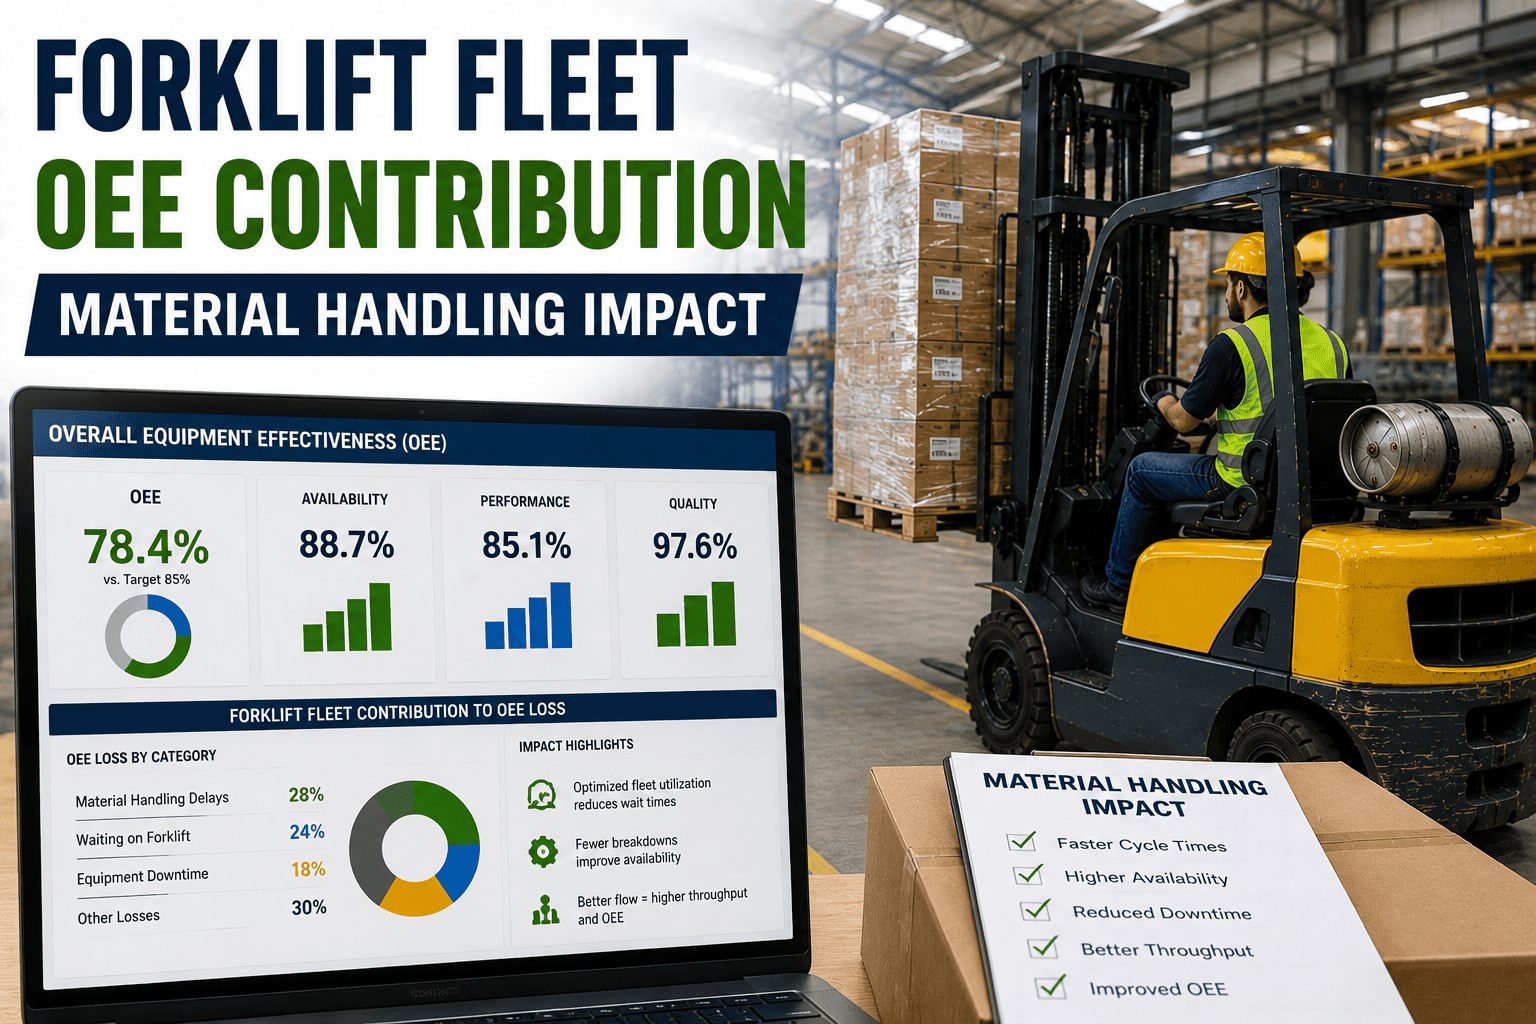
Ask most plant managers what's dragging down their OEE score and they'll point to the production line: a slow changeover, a worn tool, a quality defect. Almost nobody points to the forklift fleet, yet a truck that arrives four minutes late with the next pallet of raw material creates the exact same production stop as a jammed conveyor. Overall Equipment Effectiveness was built to measure machines, not material handling, which is precisely why forklift-caused losses hide in plain sight inside a number everyone already tracks.
OEE is calculated as Availability multiplied by Performance multiplied by Quality. Forklift fleet delays and downtime primarily erode the Availability component by causing material shortage stops, and the Performance component through minor stoppages while lines wait on parts. Measuring forklift fleet contribution to OEE means tracing production stops back to material handling events instead of assuming they belong to the machine.
The Three Components of OEE, and Where Forklifts Fit
OEE breaks manufacturing productivity into three multiplied factors: Availability, Performance, and Quality. A world-class discrete manufacturing target is roughly 85 percent Availability, 90 percent Performance, and 99 percent Quality, combining to an overall score near 85 percent. Material handling touches two of the three directly, and occasionally the third.
Availability: The Component Forklifts Hit Hardest
Availability measures how much of the planned production window a line actually runs, and unplanned stops for material shortages count directly against it. When a forklift is delayed, misassigned, or simply not where the line needs it, that gap shows up on the OEE report as an availability loss, indistinguishable on paper from a mechanical breakdown even though the machine itself never failed.
Performance: The Quiet Speed Loss
Performance measures how close a line runs to its ideal cycle time. Lines don't need to stop completely to lose performance points. A line that slows because operators are waiting on the next pallet, or running below rated speed to stretch existing material further, bleeds performance minute by minute without ever registering as a formal stoppage.
Quality: The Least Common, Most Overlooked Link
Quality losses tied to material handling are less frequent but real. Product jostled, dropped, or damaged in transit between a forklift and the line can generate scrap or rework that gets logged as a quality defect, when the root cause was actually a handling event several steps upstream.
FleetRabbit correlates forklift delivery times and delays with production stop events, so you can see exactly how much of an availability gap traces back to the fleet instead of the machine. Start a free trial to connect your fleet data, or book a demo to see it mapped against your production line.
Where Material Handling Losses Hide Inside the Score
Most plants don't track material handling as its own line item on the OEE report, so these losses get absorbed into whichever category the production system happens to log the stop under. Recognizing the pattern is the first step to separating it out.
| Forklift Event | OEE Component Affected | How It Usually Gets Logged |
|---|---|---|
| Delayed pallet delivery | Availability | Recorded as a generic "material shortage" stop, rarely traced to the specific truck or route |
| Truck breakdown mid-shift | Availability | Sometimes logged correctly as material handling downtime, but often blended into overall unplanned stops |
| Uneven staging pace | Performance | Rarely logged at all; shows up only as a line running consistently under its ideal cycle time |
| Product damaged in transit | Quality | Logged as a scrap or rework event, with the handling cause typically unrecorded |
A Simple Way to Estimate the Contribution
Pull the total minutes lost to material shortage stops over a month, and cross-reference the timestamps against forklift dispatch and delivery data for that same period. The share of those stops that align with a delayed or missing pickup is a reasonable working estimate of how much of your Availability loss is a fleet problem rather than a production problem.
FleetRabbit's dispatch and delivery timestamps line up against production stop data automatically, giving you a clear, defensible estimate of material handling's real OEE contribution. Sign up free to see your own breakdown, or book a 30-minute demo to walk through the data together.
Frequently Asked Questions
Forklift fleets rarely get credit or blame on an OEE report, mostly because nobody built the report to look for them. Once material shortage stops are cross-referenced against real dispatch and delivery data, the contribution becomes measurable instead of assumed. Plants that make this connection stop treating material handling as a background function and start treating it as what it actually is, a direct input into the number the whole plant is judged on.
FleetRabbit connects forklift dispatch and delivery data to your production stop events, giving you a clear, data-backed view of material handling's real impact on OEE. Sign up free and connect your fleet today, or book a demo to see your own OEE contribution report.