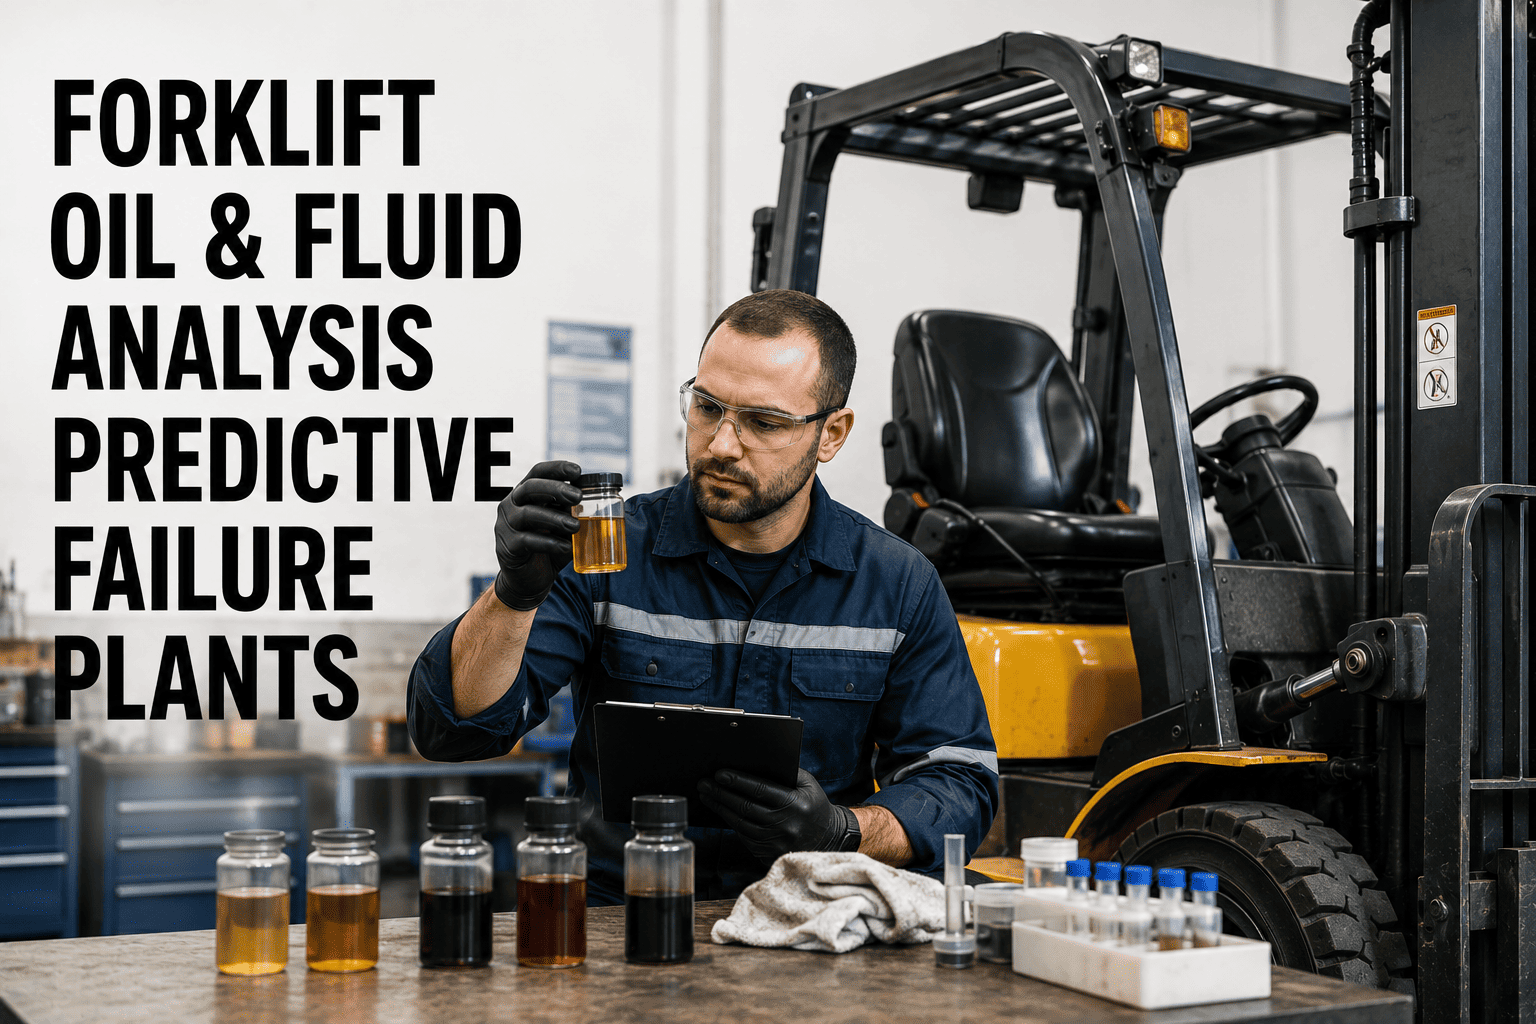
Used hydraulic and engine oil looks like waste to most people standing next to a forklift, but it is actually one of the most honest pieces of evidence a plant has about that truck's internal condition. Every gallon circulating through a hydraulic pump or an engine picks up microscopic traces of whatever is wearing inside, days or weeks before that wear shows up as a leak, a noise, or a truck that suddenly will not lift. Reading that evidence, instead of discarding it at the next oil change, is what fluid analysis actually is, and it is one of the few maintenance practices that predicts a failure rather than just reacting to one.
Oil and fluid analysis identifies developing bearing, gear, and hydraulic pump wear by measuring wear metals, contamination, and fluid degradation in a routine sample, typically detecting problems 4 to 6 weeks before any external symptom appears. Hydraulic systems in critical applications should be sampled every 250 to 500 operating hours, and engines every 250 hours or at each service. FleetRabbit logs every sample result against each truck's run hours so a rising trend across three consecutive samples triggers a scheduled repair instead of an unplanned breakdown.
What a Drop of Used Oil Actually Tells You
Fresh oil starts perfectly clean. Every hour it spends circulating through an engine or hydraulic system adds a little more evidence to it, in the form of microscopic metal particles shed by wearing components, contamination from dirt or moisture that has found its way past a seal, and gradual chemical degradation of the oil itself. A lab sample reads all three categories, and together they describe the internal health of a machine that would otherwise stay completely hidden until something breaks.
Why Trends Matter More Than Any Single Reading
A single elevated iron reading can simply mean a sampling error or a bit of contamination introduced during the draw itself. Three consecutive readings that climb together confirm something very different: a real, developing wear mechanism inside the machine. This is why oil analysis programs are built around trending rather than reacting to one report in isolation, and why a plant sampling inconsistently, or never comparing results against the same truck's history, loses most of the predictive value the practice is supposed to provide.
The Difference Between a Filing Cabinet and a Prediction Engine
Without a system tying sample results back to each truck's operating hours and prior history, lab reports tend to sit unread in a folder while abnormal wear quietly continues underneath. The value of oil analysis only shows up when someone, or something, is actively watching for the pattern across samples. Fleets ready to move oil analysis results out of a filing cabinet and into an active tracking system can start a free trial and connect lab results directly to each truck's run-hour record.
How Often to Sample Different Systems
Sampling frequency should scale with how critical the component is and how much stress the duty cycle puts on it. Getting this cadence wrong in either direction either wastes money on unnecessary sampling or misses the window where a trend would have been detectable early enough to act on.
| System | Recommended Interval | What Trending Catches |
|---|---|---|
| Hydraulic System | Every 250 to 500 operating hours | Pump wear, seal contamination, dirt ingress through breathers |
| Internal Combustion Engine | Every 250 hours or at each service | Cylinder and bearing wear, coolant intrusion, fuel dilution |
| Transmission or Drivetrain | Aligned with manufacturer drain intervals | Gear and bearing wear, additive depletion |
| After a Contamination Event | Immediately, off normal schedule | Confirms whether a seal breach or filter failure has caused internal damage |
FleetRabbit logs every oil sample result against the truck's actual operating hours, so a rising wear metal trend across consecutive samples becomes a scheduled repair instead of a surprise breakdown on the floor.
Reading Combinations, Not Single Numbers
The most useful diagnostic insight in oil analysis rarely comes from one measurement read in isolation. It comes from how two or three readings move together, since different combinations point toward genuinely different root causes on the shop floor.
Two Combinations Worth Knowing
High silicon paired with rising wear metals typically means dirt is entering through a compromised air or breather filter and accelerating abrasive wear everywhere the oil travels. High water content paired with rising acid number and a shifting viscosity reading points to oil that has been simultaneously heat-stressed and contaminated, a combination severe enough to call for immediate fluid replacement rather than waiting for the next scheduled interval.
Sampling Consistency Is Half the Battle
A sample drawn from a different point in the system each time, or taken inconsistently relative to run hours, introduces noise that makes genuine trends harder to see. Best practice calls for drawing from the same port, using the same procedure, and labeling every sample against a specific asset ID and hour reading, so comparisons across time actually mean something. Fleets that want this consistency built into their process automatically can sign up for a free trial and standardize sample tracking across every truck from day one.
What Ignoring a Lab Report Actually Costs
A lab report that goes unread is not a neutral outcome; it is a slow financial drain. A simple dirt contamination issue that would have cost little to address at the source compounds into abrasive wear, which destroys bearings, which can misalign shafts and eventually force a complete component rebuild. The gap between the cost of correcting a contamination source early and the cost of the eventual catastrophic failure it causes is often the difference between a scheduled repair during planned downtime and an emergency breakdown that stops the line.
Frequently Asked Questions
Every oil sample your fleet draws already contains the evidence of a developing failure, weeks before it becomes a breakdown. FleetRabbit connects that evidence to each truck's run hours so rising trends turn into scheduled repairs instead of surprises on the floor. Start free and put your fluid analysis data to work.







