Forklift tire brake monitoring failures don't announce themselves on a production floor until the moment they become a safety incident, a cargo loss event, or an OSHA citation. A cushion tire worn 7mm beyond its safe operating limit on the outer shoulder isn't creating a visible hazard during pre-shift walkaround — it's delivering 34% less braking surface contact under full rated load, extending stopping distance by a metre in a pedestrian-shared aisle where the margin is already measured in inches. A hydraulic brake circuit losing 5 PSI per operating shift isn't generating a fault code or alerting the operator — it's accumulating response lag across 18 days of two-shift operation until the truck that previously stopped in 2.1 metres under load requires 3.4 metres, and the racking bay it hits isn't on the maintenance team's incident radar yet. A lift truck with uneven front axle tire wear of 11% differential isn't registering as a steering complaint — it's pulling 4 degrees under braking load, compromising directional control in the narrow-aisle approach where a loaded pallet at 3-metre height means 400 kg of overhang above the counterweight's stability envelope. Manufacturing fleet safety and cost control depends on detecting these deterioration progressions before they reach the failure threshold — not documenting them after an incident investigation reveals what the maintenance schedule missed. FleetRabbit's forklift tire and brake monitoring platform converts passive equipment operation into continuous safety intelligence, tracking wear progression, brake pressure trends, and load-distribution signatures across every vehicle in the fleet so warehouse accident prevention starts with data, not hindsight. Start monitoring your fleet's tires and brakes with FleetRabbit or book a live safety monitoring demo with our team.
FleetRabbit · Forklift Safety & Cost Control
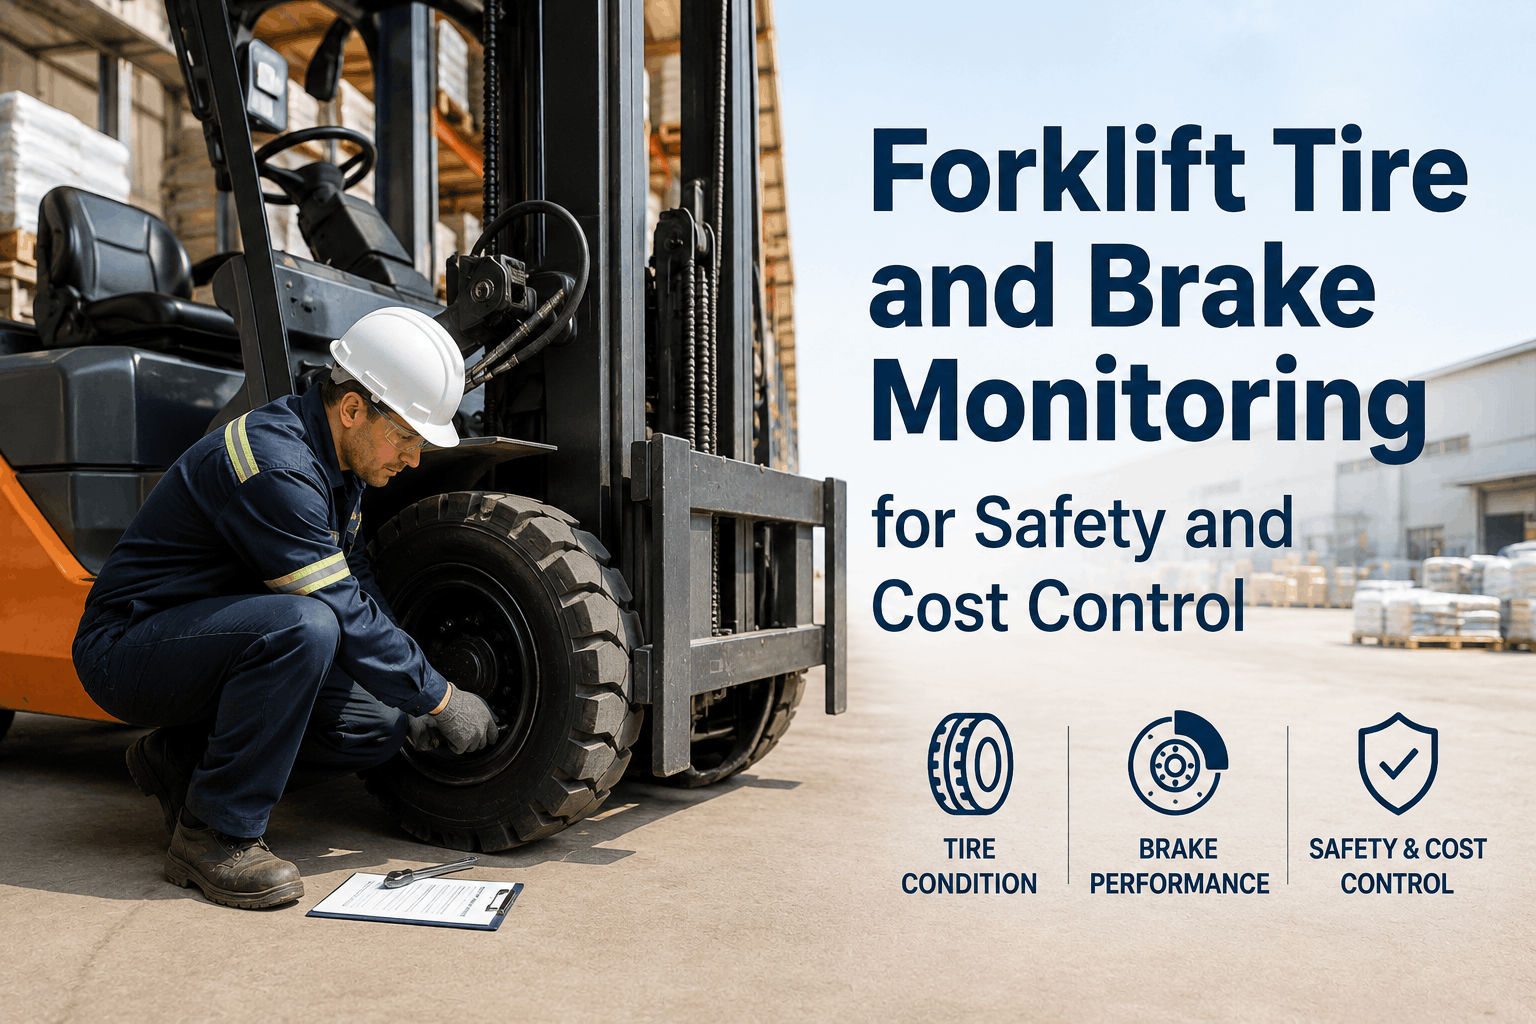
Forklift Tire and Brake Monitoring for Safety and Cost Control
How continuous tire wear monitoring and brake pressure tracking protects warehouse personnel, reduces OSHA exposure, and recovers the hidden maintenance cost that manual inspection schedules leave on the table — across every lift truck in your fleet.
73%
Of unplanned forklift downtime events trace to tire or brake system deterioration
$19K+
Average cost of a single brake-related forklift incident including investigation and downtime
3.4×
Tire component lifespan under condition-based replacement vs. visual inspection scheduling
<60s
FleetRabbit threshold breach to maintenance alert — brake or tire deviation detected
The Safety and Cost Case for Continuous Tire and Brake Monitoring
Forklift brake inspection and industrial tire maintenance programmes built on scheduled intervals share a structural liability that manual inspection cannot resolve: the interval between inspection dates is where the actual deterioration happens, and it happens invisibly. A brake system losing hydraulic pressure at 5 PSI per shift between quarterly fluid checks accumulates 195 PSI of total pressure loss before the next documented inspection — enough to extend stopping distance under full load by 60% in the scenario where a pedestrian crosses an aisle intersection. Proactive fleet monitoring replaces the inspection interval with a continuous data stream, converting every operating hour into documented evidence of tire and brake system condition.
Undetected brake degradation
+60%
Stopping distance increase at 195 PSI cumulative pressure loss — 39 operating shifts between quarterly checks
Undetected tire wear differential
11%
Axle wear differential causing 4° directional pull under braking load — invisible during operator pre-shift walk
OSHA inspection exposure
$16K
Average OSHA citation cost for inadequate forklift maintenance documentation on brake and tire systems
FleetRabbit continuous monitoring
<60s
Threshold breach to fleet manager alert — brake pressure deviation or tire wear anomaly detected and routed
Tire Wear Monitoring: What Scheduled Inspection Cannot See
Tire wear monitoring for industrial forklifts requires detection sensitivity that visual inspection structurally cannot deliver. A technician walking a forklift fleet on a monthly schedule has approximately 90 seconds per tire to assess wear condition — in the ambient light of a warehouse floor, with a vehicle that hasn't been moved to allow circumferential wear assessment, against a mental reference for "replacement threshold" that varies by technician experience and shifts with production pressure. FleetRabbit's continuous tire wear monitoring replaces that 90-second monthly assessment with a 24-hour data stream per tire — capturing pressure deviation, temperature patterns, load distribution signatures, and asymmetric wear indicators that no visual inspection programme can match.
01
Pressure deviation monitoring
Pneumatic tire pressure tracked per-tire continuously — detecting slow leaks, valve degradation, and load-induced deflection patterns that build toward a flat during a high-load pallet transfer. Pressure deviation alerts fire before the tire reaches the 20% below spec threshold where stability and braking performance are measurably compromised.
Alert threshold
±8% deviation from spec
02
Asymmetric wear detection
Load distribution sensors across the front axle identify shoulder wear differentials caused by operator turning habits, uneven load handling, floor surface irregularities, and wheel alignment drift. An 8% differential in axle load distribution indicates tire wear asymmetry developing faster than inspection intervals capture — and directional instability accumulating under braking loads.
Alert threshold
±8% axle load differential
03
Thermal wear signature tracking
Cushion and polyurethane tire temperature patterns during operation indicate structural fatigue developing ahead of visible chunking or flat-spotting. Temperature spikes above 15°C over baseline during braking cycles indicate rubber compound breakdown in the contact zone — a structural failure precursor detectable weeks before the tire presents visible delamination risk during a loaded transfer.
Alert threshold
+15°C over thermal baseline
04
Wear trajectory projection
FleetRabbit's tire wear monitoring models wear rate against actual load cycles, floor surface type, and operator turning frequency — projecting replacement date 2–4 weeks in advance per tire per vehicle. Scheduled replacement during planned downtime windows eliminates the emergency tire change during production hours that costs 4–6× more in labour and line disruption than a planned swap at shift change.
Advance notice
14–28 days before replacement
Brake System Monitoring: Pressure, Performance, and OSHA Compliance
Forklift brake inspection programmes under OSHA 1910.178 require that braking systems are inspected before each use and maintained in safe operating condition — but "inspected before each use" in practice means an operator pulling the park brake and confirming it holds stationary, not measuring hydraulic line pressure, assessing brake fluid contamination level, or documenting pad wear thickness. Industrial fleet maintenance through telematics for forklifts provides the continuous brake system data that operator pre-shift checks structurally cannot — and creates the documented OSHA forklift compliance evidence trail that inspection programmes produce on paper but fail to deliver in substance.
Hydraulic brake pressure tracking
Continuous hydraulic line pressure monitoring across all brake circuits — capturing per-shift pressure loss trends that accumulate invisibly between service events. A circuit losing 4–6 PSI per shift is flagged within 3 operating shifts of deviation onset, enabling fluid top-up, line inspection, or caliper replacement at the next planned maintenance window rather than at the moment stopping distance becomes safety-critical in a congested aisle.
Brake response lag measurement
Accelerometer data during deceleration events measures actual brake response lag — the interval between brake application signal and measurable deceleration force. Response lag trending above baseline by 80ms indicates pad wear, caliper drag, or fluid contamination affecting brake actuation speed before the operator notices any change in pedal feel or stopping confidence during normal operation.
Stopping distance trend analysis
Load-correlated stopping distance modelling calculates effective braking performance per vehicle based on measured deceleration profiles, tire contact force, and hydraulic pressure data — flagging vehicles whose actual stopping distance at rated load has drifted beyond the facility's safe operating standard before any physical incident makes the deterioration observable to operators or supervisors.
OSHA-compliant brake inspection records
Every brake system parameter reading — hydraulic pressure per circuit, fluid temperature, response lag measurement, deceleration profile — is logged per vehicle per shift with timestamp and operator attribution. The complete brake inspection record is retrievable for OSHA inspection response, insurance audit, and internal safety review in under 60 seconds — replacing paper pre-shift checklists that document compliance intention rather than measured brake performance.
Every brake deviation and tire anomaly in your fleet is measurable right now.
FleetRabbit's lift truck safety monitoring platform detects them before they become incidents — with continuous pressure tracking, wear trajectory modelling, and automated OSHA-compliant maintenance records per vehicle.
Cost Control: The Financial Case for Proactive Tire and Brake Management
Forklift cost reduction through proactive tire and brake management operates across three distinct financial categories that manual maintenance programmes consistently undercount: direct component replacement costs, indirect production downtime costs, and regulatory and incident liability costs. Warehouse fleet management programmes that account for only the first category — parts spend — typically underestimate the total financial return of condition-based monitoring by 60–70%, because the downtime and liability savings dwarf the parts cost differential for most manufacturing floor operations.
Cost category
Reactive maintenance
Scheduled PM
FleetRabbit proactive
Annual tire spend (20-vehicle fleet)
$64,000
$48,000
$31,000
Annual brake system repair spend
$38,000
$26,000
$14,000
Unplanned downtime events (annual)
24 events
13 events
3 events
Production hours lost to tire/brake groundings
192 hrs
104 hrs
24 hrs
OSHA citation exposure and incident costs
$42,000
$18,000
$2,000
Total annual tire and brake cost
$284,000
$174,000
$62,000
Annual saving vs. reactive:
Scheduled PM saves $110K
→
FleetRabbit saves $222K
FleetRabbit Platform Capabilities for Tire and Brake Safety Monitoring
Preventive maintenance forklift programmes built on telematics for forklifts require more than alert generation — they require an integrated platform that connects tire and brake condition signals to documented maintenance workflows, fleet safety dashboards, and OSHA-compliant inspection records. FleetRabbit's warehouse fleet management platform delivers the complete monitoring stack for tire and brake systems across every industrial truck class.
Per-tire pressure telemetry
Individual tire pressure transmitted continuously throughout operation. Slow leak, valve failure, and load-deflection anomalies flagged before pressure loss reaches the stability-affecting threshold. Pressure history logged per tire per shift for replacement scheduling and warranty documentation.
Hydraulic brake circuit monitoring
Continuous pressure tracking across all brake circuits with configurable per-shift loss rate alerts. Fluid temperature monitoring for contamination indication. Circuit pressure baseline established per vehicle at deployment — deviation alerts calibrated to actual operating conditions, not generic fleet averages.
Wear trajectory modelling
Machine learning wear rate models project tire replacement dates 14–28 days in advance per vehicle — accounting for load cycle intensity, floor surface type, operator turning frequency, and ambient temperature. Replacement scheduled during planned downtime, not triggered by a visible failure during production hours.
Load distribution analysis
Axle load distribution sensors identify off-centre loading patterns and asymmetric tire force signatures driving differential wear. Operator load habits profiled and flagged — enabling training intervention that extends tire lifespan across the full fleet and reduces the directional instability risk that uneven wear creates under braking load.
OSHA compliance documentation
Complete brake and tire inspection records auto-generated per vehicle per shift — timestamped, operator-attributed, and formatted for OSHA 1910.178 compliance response. Every fleet manager alert, corrective action, and maintenance intervention documented with resolution status. Retrievable in under 60 seconds for any audit scope or incident investigation.
Automated work order generation
Every tire and brake alert automatically generates a pre-populated work order with vehicle ID, system affected, deviation from baseline, severity classification, recommended action, and required components — routed to the correct technician. No manual transcription, no alert-to-action lag. Reduce forklift downtime through maintenance action initiated within minutes of threshold detection.
We operate 32 forklifts across a food manufacturing facility running three shifts. Tire and brake failures were our single largest source of unplanned equipment groundings — averaging nine events per year, with two OSHA recordable near-misses in the two years before we deployed FleetRabbit. Our pre-shift inspection programme was technically compliant: operators completed checklists, supervisors signed off, records were filed. What the checklists didn't capture was hydraulic brake pressure, and what our monthly tire inspections missed was asymmetric wear building on three vehicles whose front-axle load distribution was off by 12–14% due to persistent off-centre loading habits by specific operators. FleetRabbit flagged the load distribution issue on all three vehicles within the first six weeks of deployment. The brake monitoring identified a hydraulic pressure loss trend on two vehicles that our fluid level checks had never surfaced — one of them was losing 7 PSI per shift across a faulty caliper seal that our next quarterly brake service would have caught four weeks too late. In the 14 months since full deployment, we have had zero brake or tire related incidents, one unplanned tire grounding versus nine the prior year, and our OSHA compliance documentation is now a dashboard export rather than a four-day manual records retrieval exercise.
Fleet and Maintenance Manager, Food Manufacturing Facility
·
32 Forklifts — 3-Shift Operation — FleetRabbit Tire & Brake Monitoring Active
Frequently Asked Questions
QHow does FleetRabbit's tire monitoring work for cushion tire forklifts that don't have air pressure to measure?
For solid cushion and polyurethane tire applications — the most common tire type in indoor manufacturing and warehouse environments — FleetRabbit's tire monitoring operates through load distribution sensors, thermal signature tracking, and vibration analysis rather than pressure telemetry. Load sensors across the drive axle detect the asymmetric contact force distribution that indicates differential cushion tire wear developing faster than visual inspection would flag. Thermal monitoring during braking events identifies rubber compound breakdown in the contact zone that precedes chunking or flat-spotting. Vibration signatures during travel over consistent floor surfaces provide an indirect wear progression signal that correlates with measured wear depth in FleetRabbit's industrial tire maintenance database. For mixed fleets combining pneumatic outdoor units with cushion indoor trucks, FleetRabbit provides unified tire condition monitoring from a single dashboard with the monitoring parameters appropriate for each tire type configured per vehicle.
QWhat does FleetRabbit's brake monitoring actually measure, and how is it different from operator pre-shift inspection?
FleetRabbit's forklift brake inspection monitoring measures hydraulic line pressure per circuit in real time, brake fluid temperature as a contamination indicator, brake response lag (the measurable interval between brake application and deceleration force onset), and deceleration rate per stopping event correlated with carried load and travel speed. These parameters provide a continuous, quantified record of actual brake system performance — not a driver's qualitative assessment of whether the brake "feels normal" during a stationary park brake test. The critical difference is detection sensitivity: an operator pre-shift check confirms that the brake holds the vehicle stationary, which requires only a fraction of the system's available pressure. FleetRabbit's continuous pressure monitoring detects the degradation that occurs well before a stationary hold test would fail — at the stage where stopping distance under dynamic load has already extended 20–30% beyond the safe operating standard for the facility.
QHow does FleetRabbit's monitoring satisfy OSHA 1910.178 requirements for forklift brake and tire inspection documentation?
OSHA 1910.178(q)(1) requires that industrial trucks be examined before being placed in service and that defects found during such examination that affect safety be reported and corrected before the truck is returned to service. FleetRabbit's continuous monitoring platform extends this requirement from a pre-shift point-in-time check to a continuous operating condition record — documenting tire pressure status, brake system performance parameters, and any threshold breaches with timestamp, operating condition context, and corrective action record per shift per vehicle. Every alert generated by the monitoring system and every corrective action taken in response is logged in the platform's maintenance record with the specificity that OSHA inspection requires: what was detected, when, on which vehicle, by what means, what action was taken, and when the vehicle was returned to service. This documentation standard substantially exceeds the paper pre-shift checklist record that most operations currently use for OSHA 1910.178 compliance evidence.
Book a compliance review to confirm how FleetRabbit's records satisfy the specific documentation requirements relevant to your facility.
QWhat is the typical payback period for FleetRabbit's tire and brake monitoring platform for a 15–25 vehicle manufacturing fleet?
For a 15–25 vehicle manufacturing forklift fleet operating on a two-shift production schedule, FleetRabbit customers consistently report platform cost recovery within 60–90 days of full deployment — driven primarily by the elimination of the first one or two unplanned tire or brake-related grounding events that continuous monitoring prevents. The financial recovery model operates across three simultaneous streams: parts cost optimisation through condition-triggered replacement (average 34% parts cost reduction versus scheduled replacement), downtime elimination (each prevented unplanned grounding at $3,000–$8,000 per event in combined repair and production disruption), and OSHA compliance cost reduction (documentation programme that eliminates the manual records assembly cost of inspection responses). Full-year ROI for fleets in this size range averages 3.8× the annual platform subscription cost, with the lifecycle compounding year-over-year as the wear trend database deepens and replacement scheduling precision improves.
Create a free account to access FleetRabbit's ROI modelling tool pre-configured for your fleet size and current maintenance baseline.
FleetRabbit · Tire & Brake Safety Monitoring
Stop Discovering Brake and Tire Failures at the Point of Incident.
FleetRabbit gives manufacturing and warehouse fleets continuous per-tire pressure telemetry, hydraulic brake circuit monitoring, asymmetric wear detection, load distribution analysis, stopping distance trend modelling, OSHA-compliant inspection records, and automated work order generation — on every lift truck, across every shift.
$222K
Annual tire and brake cost saving vs. reactive baseline (20-vehicle fleet)
79%
Reduction in tire and brake related unplanned groundings within 6 months
3.4×
Tire component lifespan under condition-based vs. visual inspection replacement
<60 days
Typical platform cost recovery for a 15–25 vehicle manufacturing fleet
Tire Wear Monitoring
Brake Pressure Tracking
OSHA Compliance
Predictive Maintenance
Fleet Safety Protocols
Cost Control
May 30, 2026
By Taylor
All Posts