Ask a plant manager running three buildings how many forklifts they actually need, and most will give you the number on the lease, not the number the work requires. Forklifts do not stay put the way a stamping press or a conveyor line does. They cross between production cells, staging areas, and buildings across a campus, and every one of those moves erases the trail a fixed-position system would otherwise leave. The result is a fleet that looks fully deployed on paper while a meaningful share of it sits idle somewhere between buildings, invisible until someone finally counts hours by hand. Sign up free and FleetRabbit will show you exactly where every truck on your campus actually spends its time.
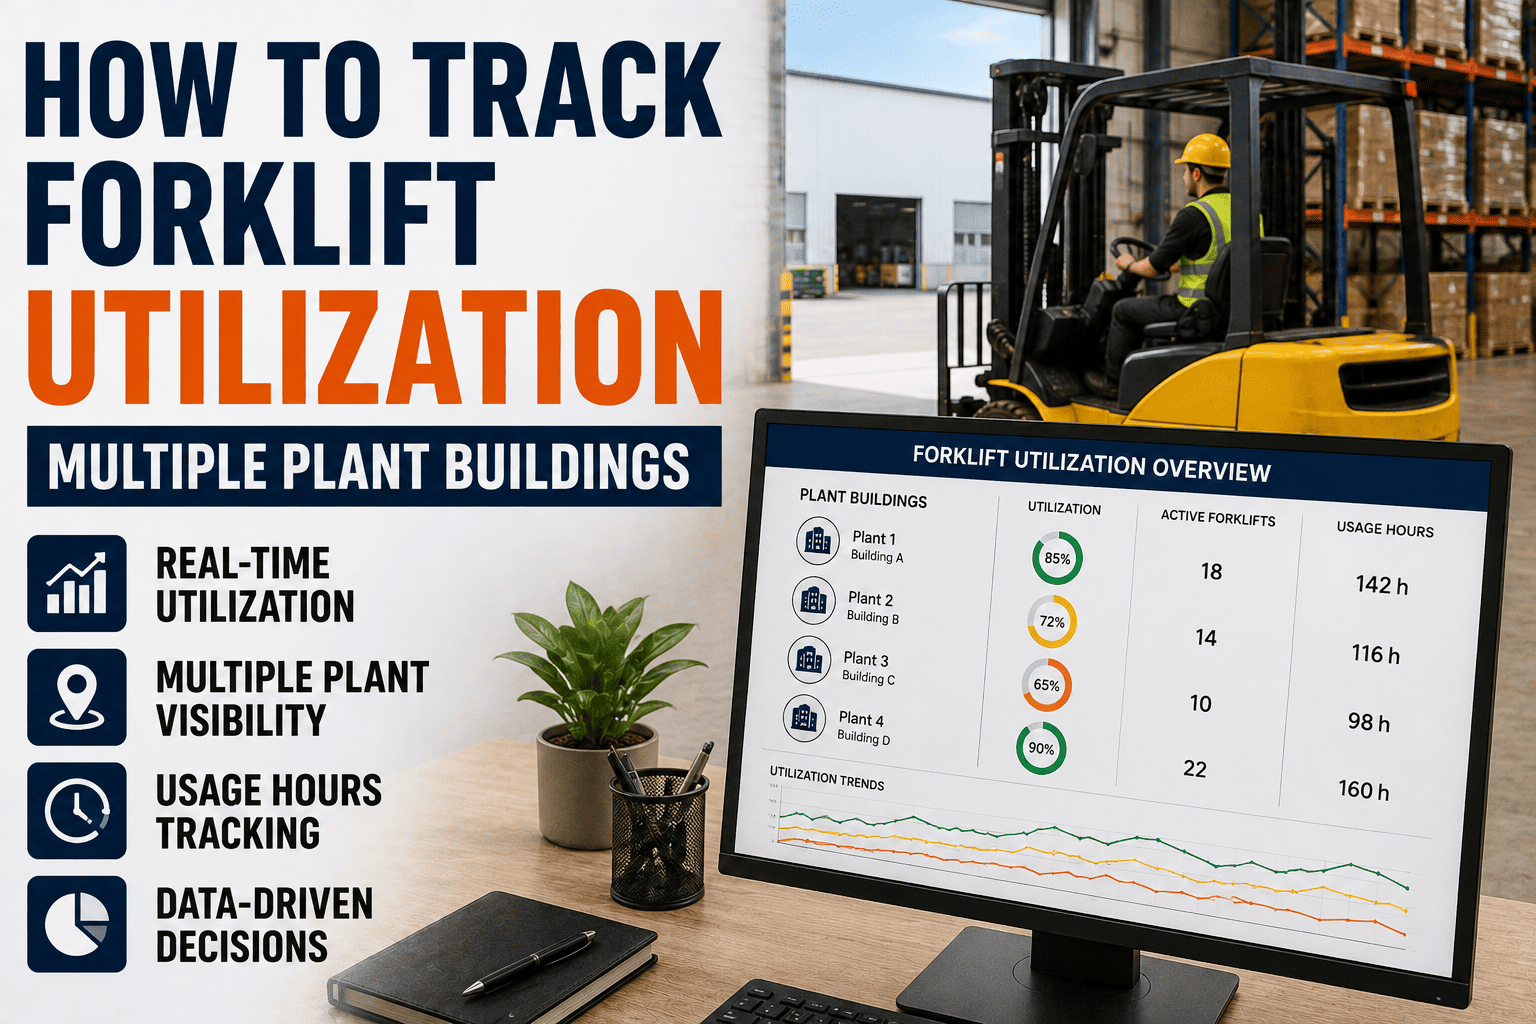
Tracking forklift utilization across multiple plant buildings requires telematics on every truck reporting location, motion state, and operating hours to one shared dashboard, not separate logs per building. North American forklift utilization has dropped to roughly 46.9 percent on average, meaning the typical fleet is idle or unproductive for more than half its available time, and that gap is largest on multi-building sites where trucks quietly drift between zones without anyone tracking the full picture.
Why Utilization Hides Across a Multi-Building Site
A single building with one loading dock and one warehouse floor makes idle equipment fairly easy to spot. A campus with several buildings, each with its own staging area and its own informal habits, makes it almost impossible without shared data. A truck that looks busy in Building A's records might actually be parked behind Building C for most of a shift, and nobody assigned to either building has the full picture to notice.
What a Single Fleet View Needs to Show
Solving this is not about adding more reports, it is about collapsing every building's data into one dashboard that answers the same four questions no matter where a truck happens to be parked right now.
Real-Time Location by Zone
Every truck should be locatable to a specific building and zone at any moment, not just a last-known reading from whenever it last synced. Trucks that habitually drift into a neighboring building's staging area are often the first sign of a fleet imbalance worth investigating.
Operating Hours Against Available Hours
Utilization only means something when it is measured against the hours a truck was actually available to work, by shift and by building, not a flat daily number that hides which building is carrying the load and which one is sitting idle.
Idle Time by Cause
Idle engine-on, powered-down, and in-transit-between-buildings are three very different situations that a single "idle" label tends to flatten into one number. Breaking idle time down by cause shows whether the fix is fewer trucks, better routing, or a scheduling change.
| Metric | What It Reveals | Action It Supports |
|---|---|---|
| Utilization Rate by Building | Which buildings are overworking their trucks and which are overstaffed with equipment | Reallocating units between buildings instead of leasing new ones |
| Cross-Building Movement | How often trucks assigned to one building actually work in another | Formalizing shared-fleet zones instead of informal borrowing |
| Idle Time by Cause | Whether idle hours come from low demand, poor routing, or waiting on a load | Targeting the actual root cause instead of cutting fleet size blindly |
| Operator Assignment | Whether specific operators or shifts consistently underuse available trucks | Adjusting scheduling before assuming the fleet itself is oversized |
FleetRabbit puts every truck on every building's floor into a single live view, showing location, operating hours, and idle time by zone so nothing gets lost moving between buildings. Sign up free and connect your whole site in one setup.
Signs Your Campus Has a Ghost Fleet Problem
Most multi-building sites do not realize how much idle capacity they are carrying until someone finally puts the numbers from every building side by side. A few patterns tend to show up first.
Fleet Size That Only Ever Grows
When a building manager cannot find an available truck, the easy answer is requesting another one. Multiply that across three or four buildings over a few years and fleet size creeps upward steadily, even while overall utilization keeps falling, because nobody is looking at whether an underused truck in a neighboring building could have covered the gap.
Inconsistent Utilization Between Buildings
One building running trucks hard while another runs the same model well below capacity is not usually a sign that the buildings need different fleets. It is usually a sign that nobody has a shared view showing the imbalance in the first place.
Building One View of a Multi-Building Fleet
The fix is rarely buying more equipment. It is almost always connecting the fleet you already have to a single view that shows every building's trucks side by side, in real time. Book a demo and FleetRabbit's team will walk through how that view maps onto your specific campus layout.
FleetRabbit tracks every forklift's location, hours, and idle time across every building on your site, giving you one dashboard to right-size, reallocate, and finally see the fleet you actually have.







