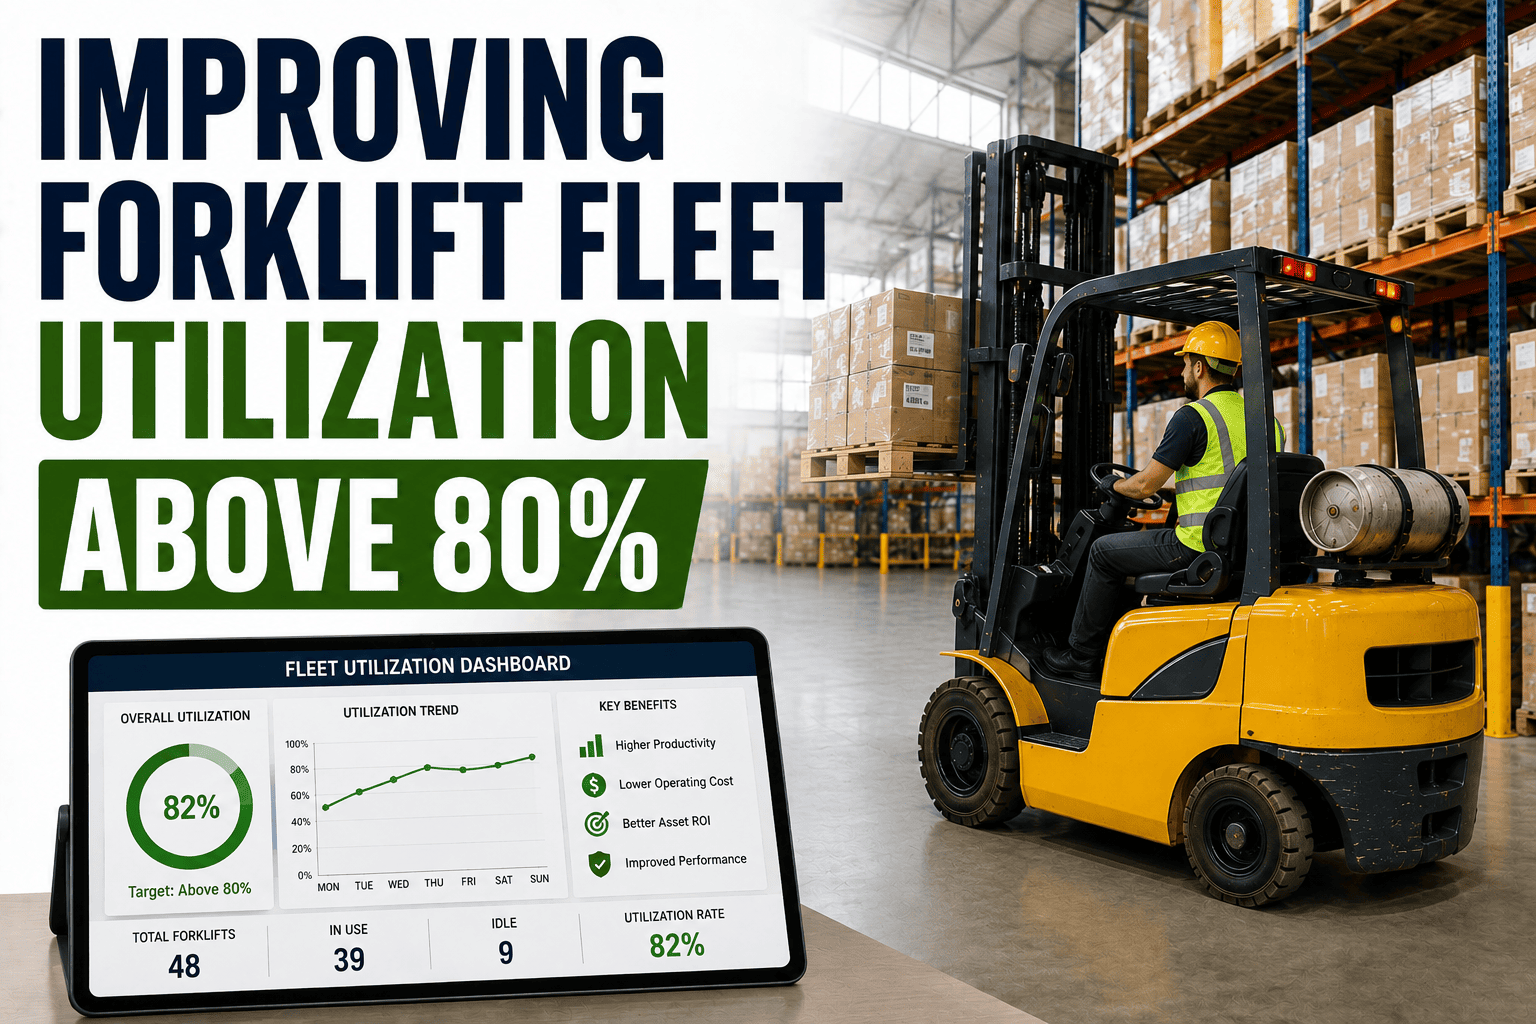
Walk any manufacturing floor at 10 a.m. and you will usually see the same thing: two or three forklifts working hard near the dock doors while a handful of others sit parked, keys in the ignition, doing nothing. Most plants never notice this because nobody is measuring it. The national manufacturing average for forklift utilization has fallen below 47 percent, which means the typical fleet spends more than half of every paid shift not moving material at all. Getting a fleet above 80 percent utilization is not about buying new equipment. It is about seeing where the current fleet is actually being used, and where it isn't.
Forklift utilization measures the share of a shift a truck spends in productive motion. Industry benchmarks put a healthy range at 60 to 80 percent, yet the North American manufacturing average sits near 47 percent. Plants that push past 80 percent do it through right-sizing, shift-level scheduling, and real-time utilization data rather than adding more trucks.
Why Utilization Above 80% Is So Rare
Utilization sounds like a simple number, but very few plants track it accurately. Most operations still rely on operator memory, paper logs, or a rough sense of how busy the floor "feels." Without a real measurement, three quiet problems build up unnoticed: too many trucks assigned to a shift that doesn't need them, uneven workloads where one truck runs nearly non-stop while another idles for hours, and dispatch decisions made by habit instead of demand. Each of these alone can drag a fleet from a strong 75 percent down toward the 40s.
The Hidden Cost of Low Utilization
Material handling typically accounts for 15 to 40 percent of total manufacturing operating cost. When a truck sits idle for a third of its shift, the plant is still paying for the lease or depreciation, the insurance, and often the operator's time, regardless of how much material actually moved. A fleet running at 45 percent utilization is not a fleet that is "fine but not perfect." It is a fleet carrying two or three more trucks than the operation needs, each one adding cost without adding output.
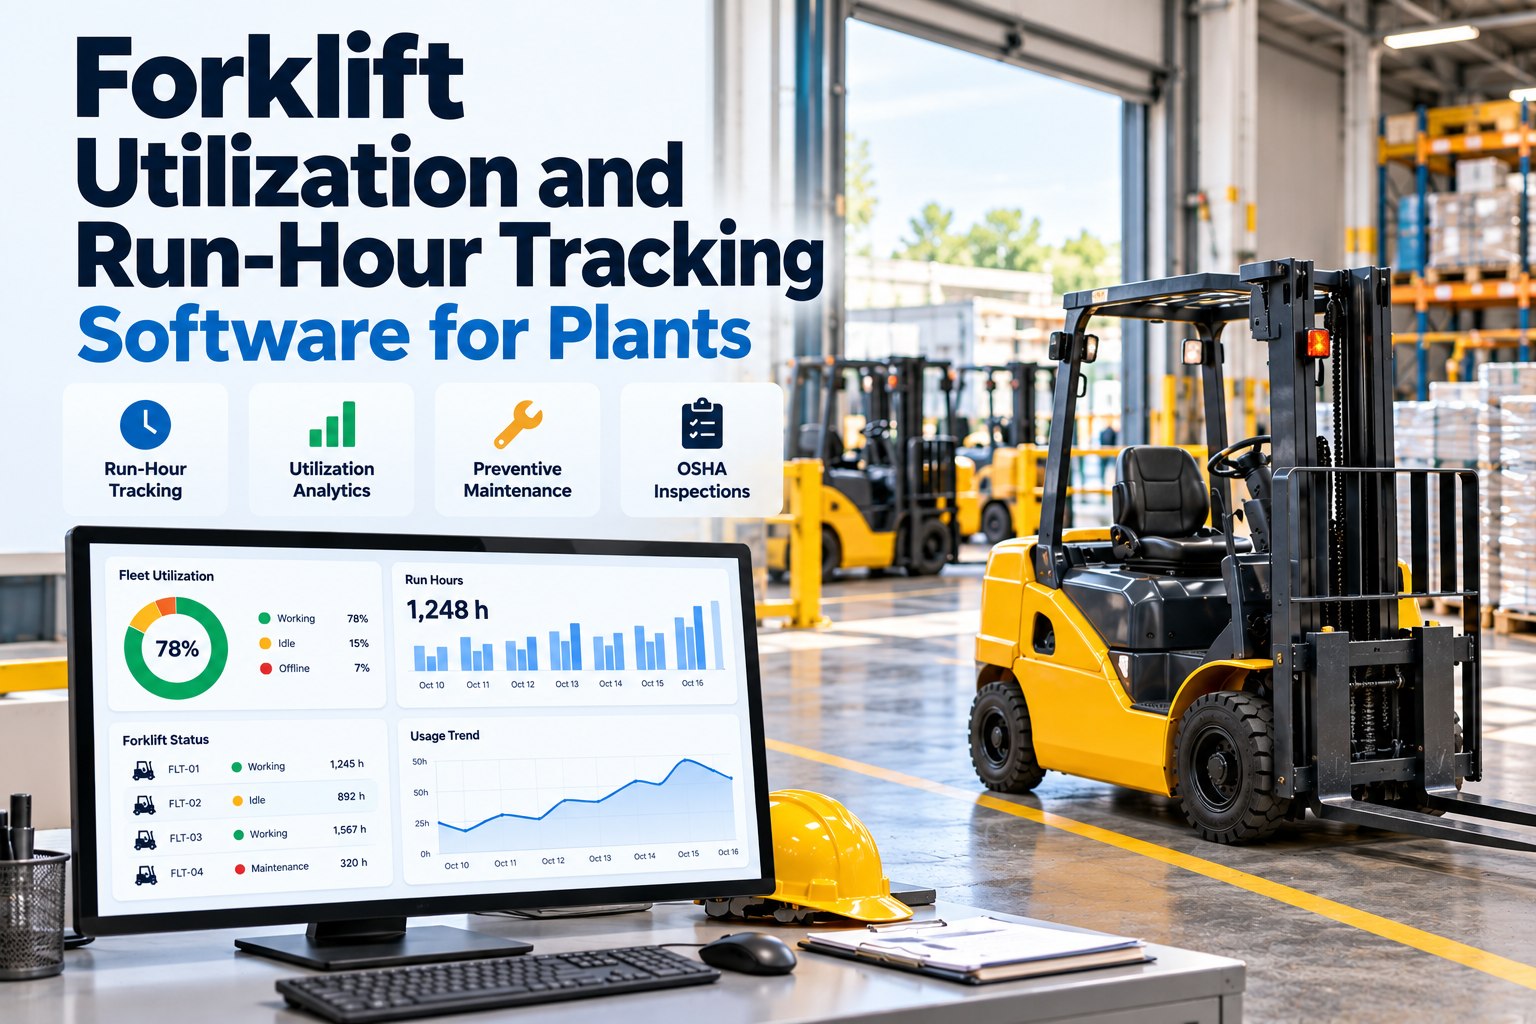
FleetRabbit connects to your existing forklift fleet and shows exactly how many hours each truck spends in productive motion versus idle. Most plants discover their real number within the first week. Start a free trial to see your fleet's utilization dashboard, or book a demo to walk through it with our team.
What "Utilization" Actually Measures
Utilization is often confused with uptime, but the two answer different questions. Uptime asks whether a truck is mechanically available to work. Utilization asks whether an available truck is actually being used productively. A forklift can have perfect uptime and still sit parked for six hours of an eight-hour shift, which is exactly what drags the plant-wide average down.
Time Utilization vs. Capacity Utilization
Time utilization is the percentage of a shift a truck spends in motion rather than idle or unassigned. Capacity utilization goes a step further and asks whether that motion is doing enough work, comparing actual loads moved per hour against the truck's rated capacity. A truck can look busy on paper yet still be underperforming if it is moving light loads on short runs when it could be handling more.
Time Utilization
Measured in motion-hours against total scheduled shift hours. This is the number most benchmarks reference, including the 60 to 80 percent healthy range and the 46.9 percent national average.
Capacity Utilization
Measured in output per operating hour against the equipment's rated throughput. A gap here usually points to operator technique, task mismatches, or a truck class that is oversized or undersized for the work it is assigned.
| Utilization Range | What It Usually Means | Recommended Action |
|---|---|---|
| Below 40% | Fleet is likely oversized for current demand, or scheduling is misaligned with actual shift workload | Right-size the fleet; reassign or retire underused units |
| 40–60% | Typical for plants without motion-hour tracking; workload is often uneven across trucks | Introduce zone and shift-level utilization tracking |
| 60–80% | Generally accepted healthy benchmark for a well-matched fleet | Maintain balance; watch for wear on the busiest units |
| Above 80% | Elite performance driven by data, but sustained high load accelerates service intervals | Shift preventive maintenance to hour-based, not calendar-based, tracking |
Five Levers That Push Utilization Toward 80%
Plants that consistently operate above the industry average rarely do it through a single change. Utilization improves when several small corrections compound across a fleet.
Calculating Your Plant's Utilization Score
The basic formula is straightforward: divide total productive motion-hours by total scheduled shift-hours across the fleet, then multiply by 100. A 50-truck fleet scheduled for 400 hours a day that logs 220 productive motion-hours is running at 55 percent utilization, sitting squarely in the range where most manufacturing plants operate today. Running this calculation by truck, by shift, and by zone rather than as a single plant-wide average is what separates a useful diagnostic from a vanity metric.
FleetRabbit tracks utilization continuously per vehicle, per shift, and per plant zone, so right-sizing and scheduling decisions are based on data instead of instinct. Sign up free and connect your fleet in minutes, or book a 30-minute demo to see it mapped to your facility layout.
Frequently Asked Questions
An 80 percent utilization target is not a number you hit by pushing every truck harder. It comes from knowing, shift by shift and zone by zone, where the fleet is earning its cost and where it is standing still. Plants that get this visibility tend to find the same pattern: a handful of trucks doing most of the work while several others quietly consume budget in the background. Closing that gap is usually the fastest, cheapest improvement available on the floor.
Most plants are surprised by their first real utilization report. FleetRabbit shows you exactly which trucks are earning their keep and which ones are quietly costing you money every shift. Sign up free and connect your fleet today, or book a demo to see your data live.