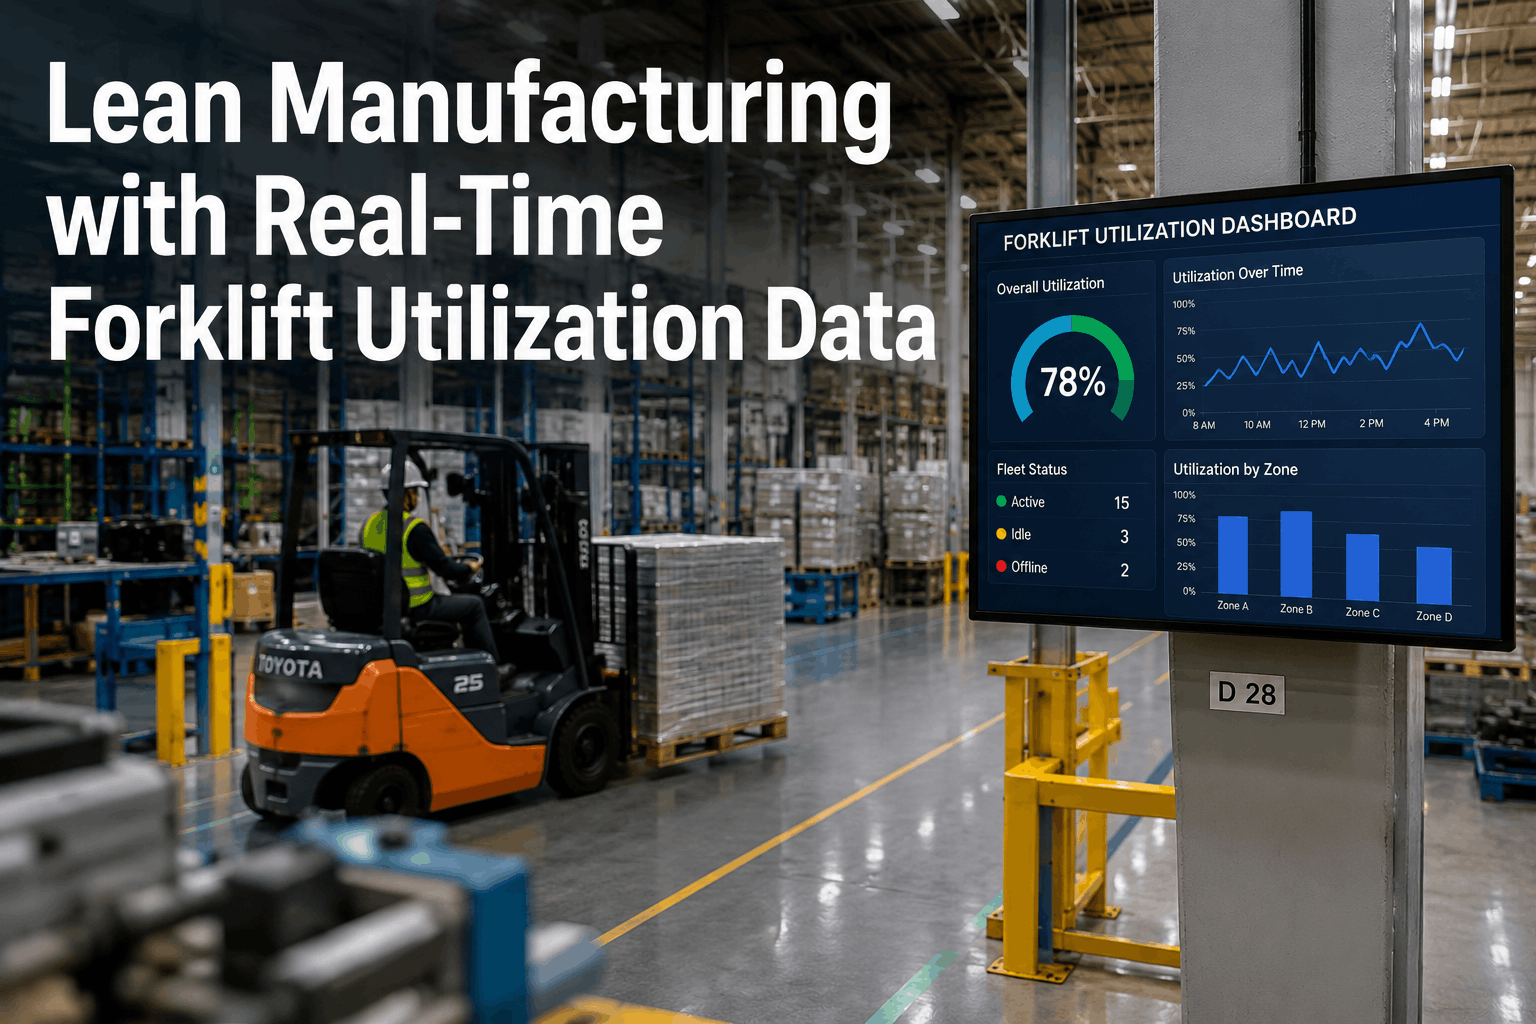
Lean Manufacturing with Real-Time Forklift Utilization Data
Lean manufacturing's foundational promise — eliminate waste, maximise flow, protect productive capacity — runs directly into a structural blind spot in most production facilities: the forklift fleet that moves every material input and every finished output across the plant floor is almost entirely invisible to the lean data infrastructure managers rely on for continuous improvement decisions. Kaizen teams map value streams, production engineers analyse takt time deviation, and operations directors review OEE dashboards — while the forklifts, reach trucks, and order pickers that connect every production cell to every storage location idle unmonitored, travel unmeasured, and consume productive capacity unreported. That invisibility is not a minor gap in the lean data picture. Material handling accounts for 15–40% of total manufacturing operating cost in most production environments — and the waste embedded in an unmonitored forklift fleet routinely exceeds the gains that facility-wide lean initiatives achieve in a full operating year. Fleet Rabbit's real-time forklift utilization analytics platform was built specifically to close this gap — connecting plant fleet telemetry, utilization reporting, route analytics, and idle detection into a single operational intelligence layer that makes lean material flow measurable, improvable, and sustainable. Explore Fleet Rabbit's lean fleet analytics with a free account or book a live utilization analytics demo with our team.
Why Lean Manufacturing Programmes Stall Without Forklift Utilization Data
Lean programmes in manufacturing facilities typically achieve strong early results in production cell layout, setup time reduction, and inventory positioning — then plateau. The plateau often traces back to the same structural cause: material handling, the connective tissue between every lean improvement made inside production cells, was never measured with the same rigour as the production processes it supports. A production line optimised for one-piece flow still waits for material if the forklift delivering to its supermarket location is idling on the other side of the plant. A kanban system designed around precise replenishment timing fails if forklift utilization data cannot confirm that replenishment cycles are actually being executed on schedule. Fleet Rabbit's forklift utilization analytics platform addresses each of these material flow intelligence requirements at the feature level — not through workarounds applied to a generic fleet tracking tool, but through capabilities designed from the ground up for lean manufacturing material handling operations.
Fleet Rabbit Lean Fleet Analytics — At a Glance
2s
Live forklift position and status updates — every vehicle, every zone, every minute of every shift
31%
Average idle time reduction in facilities deploying Fleet Rabbit utilization analytics within 90 days
<60s
Fleet utilization report generation — per shift, per zone, or per vehicle on demand for kaizen teams
22%
Average throughput increase per vehicle in Fleet Rabbit-managed lean manufacturing fleets within the first operating year
See every lean fleet analytics feature running live. Fleet Rabbit's manufacturing fleet platform connects real-time utilization tracking, idle detection, route analytics, and lean waste reporting in one operational intelligence system.
Core Lean Fleet Analytics Features: A Full Capability Overview
Fleet Rabbit's lean manufacturing forklift utilization platform is built around six integrated capability areas — each addressing a distinct material handling intelligence requirement of a lean production environment, and each feeding the same central analytics layer that surfaces waste, confirms flow, and guides continuous improvement decisions for operations leaders and kaizen teams.
Fleet Rabbit Lean Fleet Analytics Feature ArchitectureSix integrated capability areas — one unified material flow intelligence layer per facility
01
Real-Time Forklift Utilization Tracking
Telematics sensors installed on every forklift, reach truck, and order picker transmit operating status, location, and activity data every two seconds to Fleet Rabbit's plant floor dashboard — updated live, visible across all vehicles simultaneously. Each vehicle's operational state is classified in real time: productive travel, load/unload activity, idle engine-on, and powered-down. Utilization rates are calculated continuously per vehicle, per shift, and per plant zone — giving operations managers the precise productive capacity picture that lean material flow improvement requires. Historical utilization data is accessible per vehicle, per operator, and per production zone without any manual data compilation or spreadsheet assembly.
02
Idle Time Detection and Waste Classification
In lean manufacturing terms, every minute a forklift engine runs without moving material is a form of waiting waste — the most visible and most correctable muda in material handling operations. Fleet Rabbit's idle detection engine logs every idle event by vehicle, operator, zone, and time of day — classifying idle events by duration, location, and frequency pattern. Idle hotspots by zone and shift surface where material handling workflow design is creating queuing, where supermarket replenishment timing is misaligned with production demand, and where operator behaviours are generating avoidable wait time. Every idle event is timestamped and attributed, giving kaizen teams the evidence base for targeted material flow redesign rather than general observations from timed observations on the shop floor.
03
Route Analytics and Travel Distance Optimisation
Fleet Rabbit maps actual forklift travel paths across the plant floor — aggregating route data by shift and vehicle to surface the travel patterns that define current material handling flow. Excessive travel distance is the transportation waste that lean practitioners target most directly, but without route analytics, the actual travel footprint of a forklift fleet is estimated rather than measured. Fleet Rabbit's route analytics identify which vehicles are travelling the furthest per productive cycle, which zones generate the most cross-plant traffic, and which material flow paths diverge most significantly from the theoretical lean layout — giving facilities engineers the data to redesign storage locations, adjust supermarket positioning, and restructure routes around actual observed travel patterns rather than assumptions.
04
Zone-Level Utilization and Congestion Analytics
Plant floor zones — receiving docks, raw material storage, line-side supermarkets, finished goods staging — each generate distinct demand patterns across shifts and production schedules. Fleet Rabbit's zone-level analytics show vehicle density, average dwell time, and peak congestion periods per zone per shift — identifying where material handling capacity is under-deployed relative to production demand and where congestion is generating the waiting and transportation waste that lean value stream maps identify but rarely quantify with real fleet data. Zone analytics directly support supermarket design decisions, tugger route timing, and dock scheduling improvements that compound lean material flow gains across the full production environment.
05
Operator Performance and Throughput Benchmarking
Forklift utilization data becomes a lean continuous improvement tool when it is connected to operator performance — identifying not just how much each vehicle is used, but how productively each operator deploys that vehicle across their shift. Fleet Rabbit's operator benchmarking module scores productive cycle completion rates, idle time per operator, and material handling throughput per shift hour — enabling supervisors to identify both top performers whose practices can be standardised and underperforming operators whose coaching needs are rooted in specific, measurable behaviour patterns rather than general performance concerns. Operator benchmarking data is accessible per shift, per department, and per vehicle class — supporting lean standard work development with the actual performance data that time studies alone cannot capture at scale. Sign up for Fleet Rabbit to activate operator performance analytics for your entire manufacturing fleet from day one.
06
Fleet Right-Sizing and Asset Deployment Intelligence
Lean manufacturing's asset management principle — deploy only the capacity genuinely required to support flow — is impossible to execute without accurate fleet utilization data. Fleet Rabbit's asset deployment analytics reveal the actual utilization distribution across the forklift fleet: which vehicles run at productive capacity for 80% of each shift, which idle 60% of every shift regardless of demand pattern, and which are chronically underdeployed relative to the zones they are assigned to serve. That utilization distribution enables lean-aligned fleet right-sizing decisions — redeploying underutilised vehicles to high-demand zones, eliminating ghost assets from the lease portfolio, and building the factual case for capital investment decisions on replacement or fleet expansion that finance teams require before committing capital to industrial equipment.
Lean Waste Types Targeted: Fleet Rabbit Analytics by Muda Category
The Toyota Production System identifies seven categories of manufacturing waste that lean practitioners work systematically to eliminate. Four of those seven waste categories — transportation, motion, waiting, and overprocessing — are directly measurable and improvable using forklift utilization telemetry. The table below maps Fleet Rabbit's core analytics features to the specific lean waste categories they address, giving lean programme leaders a clear framework for sequencing material handling improvement initiatives based on their highest-impact waste drivers.
Fleet Rabbit Analytics Features vs. Lean Waste Categories (Muda)
Lean Waste Category
Material Handling Manifestation
Fleet Rabbit Feature
Measurable Output
Transportation Waste
Excessive forklift travel distance per material cycle
Route analytics and travel distance mapping
Actual travel metres per cycle by vehicle, zone, and shift — baseline and improvement tracking
Waiting Waste
Forklift idle time, operator wait time, production line starvation
Idle detection and waste classification engine
Idle minutes per vehicle per shift, classified by zone, duration, and frequency pattern
Productive cycle completion rate per operator versus fleet benchmark standard
Overproduction Waste
Excess fleet capacity generating unnecessary material movement
Fleet right-sizing and asset deployment analytics
Utilization distribution across fleet — identifies ghost assets and underdeployed capacity
Inventory Waste
Supermarket overflow, WIP accumulation, staging area congestion
Zone-level congestion and dwell analytics
Average dwell time and vehicle density per zone per shift — surfaces staging imbalances
Defect Waste
Product damage from forklift impact, rework from mispicked material
Impact detection and operator safety scoring
Impact event frequency by vehicle, operator, and zone — supports root cause investigation
Fleet Rabbit generates lean waste analytics automatically as part of continuous fleet monitoring — no manual observation programmes, no time-study scheduling, no after-the-fact data reconstruction from paper logs or radio call records.
See which analytics features apply to your facility's lean programme priorities. Our manufacturing fleet team will map your specific waste reduction objectives to the right Fleet Rabbit analytics configuration for your plant layout and vehicle mix.
Advanced Lean Analytics Features for Manufacturing Operations
Beyond the core utilization monitoring and waste detection capabilities, Fleet Rabbit's lean manufacturing fleet analytics platform includes a suite of advanced features that address the operational complexity of multi-cell production environments, high-mix low-volume scheduling, and enterprise manufacturing networks running hundreds of material handling vehicles across multiple plant locations.
Advanced Lean Analytics Features — Fleet Rabbit Manufacturing Platform
Production-Linked Demand Analytics
Fleet Rabbit correlates forklift utilization patterns against production schedule data — surfacing which production runs generate the highest material handling demand, which schedule sequences create avoidable congestion at shared storage locations, and where material handling capacity should be pre-positioned before demand spikes rather than redeployed reactively. Production-linked demand analytics enable lean planners to design material handling shift patterns around actual observed demand rather than averaged historical assumptions.
Shift-Comparison Lean Benchmarking
Lean continuous improvement requires comparison baselines. Fleet Rabbit's shift-comparison benchmarking presents utilization, idle time, travel distance, and throughput metrics side-by-side across shifts, weeks, and improvement periods — making kaizen event impact visible in quantified before-and-after data that plant managers can present to leadership rather than relying on observation-based assessments. Improvement trajectories are tracked automatically without requiring any manual data export or spreadsheet consolidation between reporting periods.
Plant-Wide Lean KPI Dashboard
A single-screen operational view shows real-time fleet utilization, active idle alerts, zone congestion levels, and shift throughput performance across the entire manufacturing facility — colour-coded by performance against lean target thresholds and filterable by production area, vehicle class, and shift. Operations leaders see in real time which zones are performing within lean material flow parameters and which are generating the waste signals that require kaizen team investigation — without drilling through individual vehicle records or waiting for end-of-shift reporting cycles.
Value Stream Map Integration Data
Value stream mapping requires accurate cycle time, wait time, and transport time data at each process step — data that most lean teams collect through periodic manual observation rather than continuous measurement. Fleet Rabbit's telemetry data exports provide the continuous material handling cycle time, transport duration, and dwell time inputs that make VSM quantification accurate rather than estimated — enabling value stream maps that reflect actual current-state performance rather than a snapshot from a single timed observation session.
Predictive Maintenance for Uninterrupted Flow
Unplanned forklift downtime is one of the most disruptive forms of material handling waste in a lean environment — stopping material flow to production cells that depend on precise replenishment timing. Fleet Rabbit tracks engine hours, fault code frequency, and utilization intensity per vehicle — generating predictive maintenance work orders before mechanical failures interrupt production. PM compliance rates for Fleet Rabbit-managed manufacturing fleets average 96% within 60 days of deployment, eliminating the unplanned downtime events that lean production scheduling cannot absorb without production stoppages.
Lean Waste Trend Reporting and Alert Engine
Fleet-wide analytics identify which vehicles, zones, operators, and shift patterns generate the highest frequency of waste events — idle spikes, excessive travel, congestion dwell — enabling lean programme leaders to intervene at the systemic root cause rather than managing individual events in isolation. Trend data surfaces deteriorating material flow patterns before they produce production stoppages or throughput shortfalls, and shift-level waste alerts notify supervisors in real time when utilization or idle metrics cross the lean threshold boundaries that kaizen teams have defined as the acceptable performance window.
Want to see the lean analytics dashboard running on your plant's fleet data? Book a demo and our team will configure a live walkthrough using a fleet profile that matches your vehicle mix, production layout, and lean programme objectives.
The operational and continuous improvement gap between traditional lean material handling observation approaches and Fleet Rabbit's integrated analytics platform is measurable in waste events identified, kaizen cycles accelerated, and improvement management hours eliminated. This comparison reflects what manufacturing lean programmes gain — and what they sacrifice — based on their material handling data infrastructure.
Lean Material Handling Data Approach Comparison
Manual / Observation-Based Approach
❌
Timed observation snapshots — one or two data points per shift per vehicle
Idle waste identified after shift end, not during productive hours
Travel distance estimated from facility maps — never measured per cycle
VSM cycle times from single-session observations with high variance
Fleet right-sizing based on supervisor opinion, not utilization evidence
Reactivewaste discovered through observation — after it has already consumed productive capacity
Fleet Rabbit Lean Analytics Platform
✔️
Two-second telemetry updates — continuous utilization record per shift
Idle alerts generated in real time — supervisor notified during the event
Actual travel path mapped per cycle — baseline and improvement tracking
Continuous cycle time data for VSM — no observation scheduling required
Utilization distribution data — right-sizing decisions backed by evidence
Proactiveevery material handling waste event detected, measured, and attributed — every shift, automatically
Stop Estimating Material Handling Waste. Start Measuring and Eliminating It Automatically Every Shift.
Fleet Rabbit replaces observation-based lean material handling programmes with a continuous analytics platform that captures utilization data, classifies idle waste, maps travel routes, and benchmarks operator throughput automatically — on every shift, across every vehicle, with zero manual data collection or spreadsheet compilation.
Fleet Rabbit Lean Analytics by Manufacturing Environment Type
Lean manufacturing material handling requirements vary significantly by production model, facility scale, and product complexity. Fleet Rabbit's platform configures to the specific operational profile of each manufacturing environment — from single-cell assembly operations to high-mix production facilities running dozens of material handling vehicles across multiple production buildings simultaneously.
Lean Fleet Analytics Configuration by Manufacturing Environment
Plant-to-plant lean performance comparison for best-practice standardisation
Enterprise dashboard with plant-level drill-down, cross-site improvement tracking
Fleet Rabbit's lean analytics configuration is completed during onboarding by a manufacturing fleet specialist — no generic dashboard templates, no one-size-fits-all idle thresholds, no workarounds for production-environment-specific material flow requirements.
We run a high-mix automotive component assembly facility — 26 forklifts and reach trucks across three production buildings, two shifts, with a kaizen programme that has been active for six years. Before Fleet Rabbit, our material handling waste analysis was entirely observation-based: industrial engineers on the floor with clipboards, timed observations that we could only run once or twice per quarter per zone, and VSM cycle time data that was already stale by the time it reached the improvement team. We were finding waste by watching for it. After Fleet Rabbit, we measure it continuously. In the first 90 days, the platform surfaced an idle pattern in our raw material storage zone that our observation programme had completely missed — a 38-minute average idle window between first-shift and second-shift handover that was generating a replenishment gap to four production cells. We redesigned the handover protocol using the Fleet Rabbit data as the evidence base. The gap closed, the replenishment delay eliminated, and our OEE in those four cells improved by 6 percentage points in the following month — a result we could not have achieved without the continuous utilization data that showed us exactly where the waste was concentrated.
— Lean Operations Director, Automotive Component Manufacturer — 26 Material Handling Vehicles — 3 Production Buildings — Fleet Rabbit Lean Analytics Active
Frequently Asked Questions
How does Fleet Rabbit's forklift telemetry hardware install on existing manufacturing fleet vehicles?
Fleet Rabbit's telemetry units install on existing forklifts, reach trucks, and order pickers via a self-contained cellular-connected data module — connecting to the vehicle's CAN bus or hour-meter circuit without modification to the vehicle's primary operating systems. Installation is completed by a Fleet Rabbit-certified technician in 45–75 minutes per vehicle depending on vehicle class. For indoor facilities where cellular signal is attenuated by steel structures, Fleet Rabbit supports Wi-Fi gateway-assisted transmission and UWB beacon-assisted positioning for sub-metre location accuracy in high-density racking environments. The complete hardware specification for your vehicle mix and facility layout is confirmed during the pre-deployment assessment at no cost before any equipment is ordered or installed.
Can Fleet Rabbit's lean analytics data integrate with our existing MES, WMS, or ERP systems?
Fleet Rabbit offers API-based integration with major Manufacturing Execution Systems, Warehouse Management Systems, and ERP platforms — enabling bidirectional data flow between fleet utilization telemetry and production scheduling, inventory management, and labour reporting systems. Facilities running SAP, Oracle, Infor, or Blue Yonder have deployed Fleet Rabbit as a real-time material handling data layer that enriches existing lean and production management infrastructure without replacing it. Schedule a demo to review the integration options available for your specific technology environment.
How does Fleet Rabbit support kaizen events and lean improvement cycle documentation?
Fleet Rabbit's analytics platform supports lean kaizen cycles at every stage: pre-event current-state data export provides the quantified waste baseline that replaces manual observation; during-event live dashboard monitoring lets the improvement team track material flow in real time as changes are trialled on the floor; and post-event trend comparison automatically measures improvement against the pre-event baseline — generating before-and-after utilization, idle, and throughput comparisons in under 60 seconds without any manual data consolidation. Kaizen event documentation packages — including timestamped baseline data, improvement period data, and quantified waste reduction results — are exportable in formats suitable for A3 reporting and leadership review presentations. Sign up for a free account to explore the kaizen support analytics available for your programme.
How does Fleet Rabbit handle lean analytics for multi-shift and 24/7 manufacturing operations?
Fleet Rabbit's platform is designed for continuous multi-shift operation — capturing utilization, idle, and route data across all shifts without any manual shift-change data handover. Shift-boundary analysis automatically compares performance metrics across shifts, surfacing the handover gaps, first-hour efficiency patterns, and shift-specific waste signatures that single-shift observation programmes cannot detect. For 24/7 operations, Fleet Rabbit maintains a continuous rolling utilization record with shift-level segmentation that lean coordinators can query for any shift, any week, and any improvement period without needing to reconstruct data from multiple sources. Shift supervisors receive automated lean performance summaries at shift end — quantified against the facility's lean KPI targets without any manual reporting preparation.
Every Lean Analytics Feature. One Platform. Every Shift's Waste Measured.
Fleet Rabbit gives manufacturing lean programmes real-time forklift utilization tracking, continuous idle waste detection, route distance analytics, zone congestion intelligence, operator throughput benchmarking, and predictive maintenance — unified in a single analytics platform that measures material handling waste automatically on every shift, across every vehicle, in every production zone.