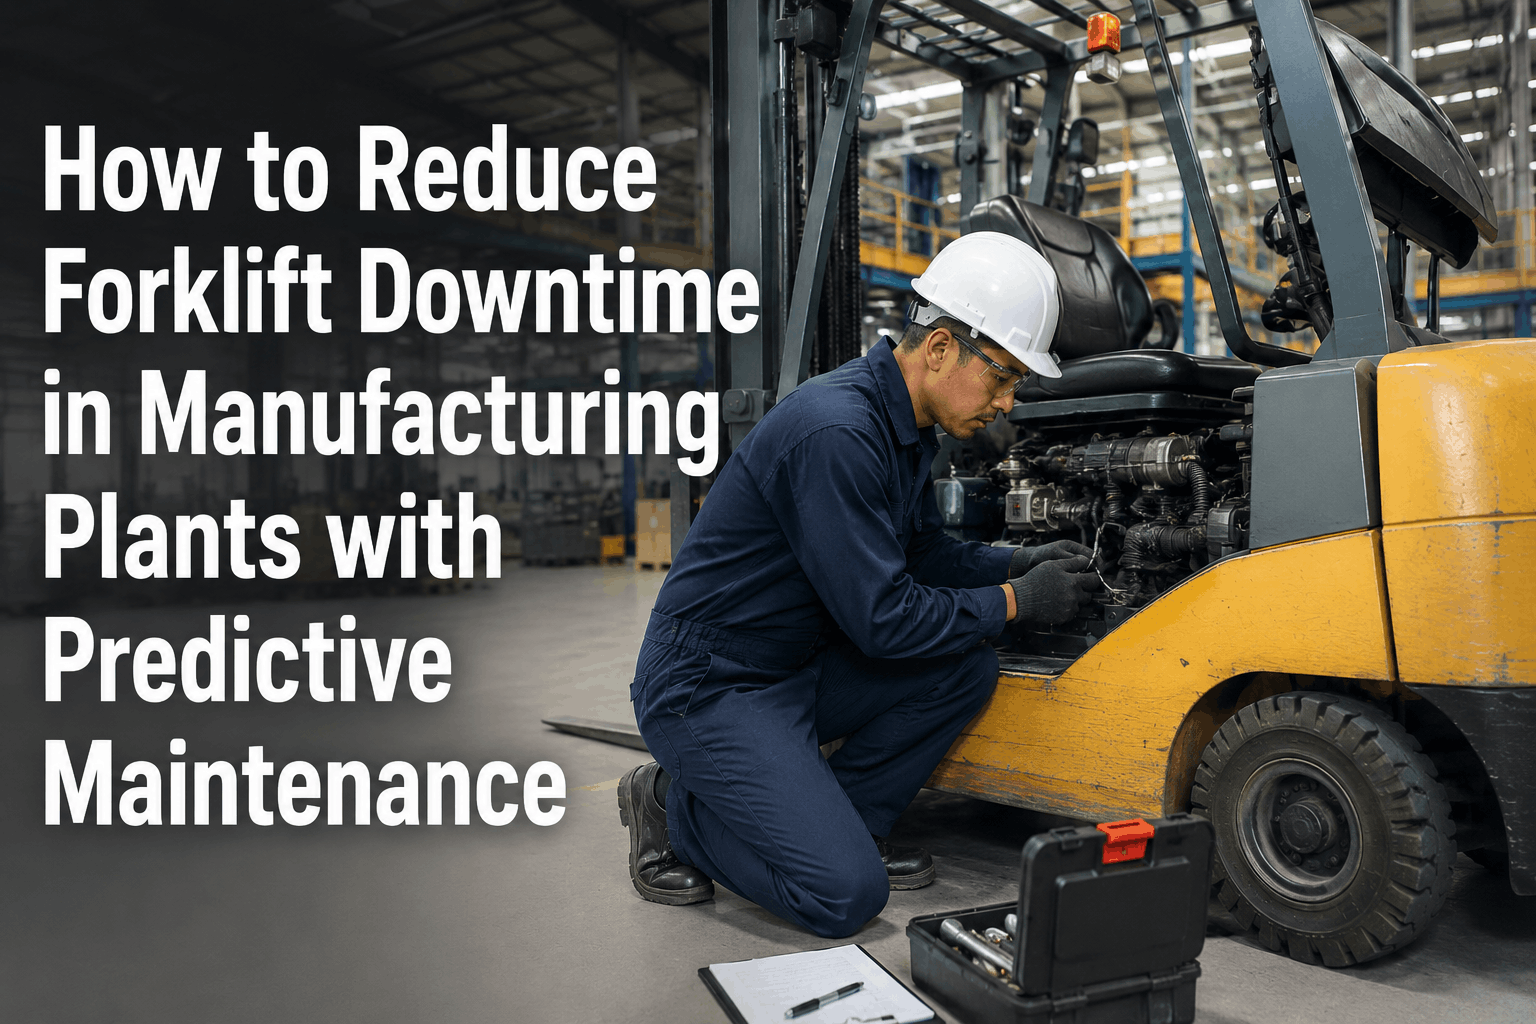
Every unplanned forklift breakdown in a manufacturing plant triggers a cascade that extends far beyond the cost of the repair itself. The pallet move doesn't happen. The production line waits. The maintenance technician drops whatever scheduled work they were doing to respond. The supervisor scrambles to reallocate tasks across a fleet that was already running at capacity. By the time the forklift is back in service, the indirect costs — lost production time, overtime to recover the schedule, expedited parts shipping, and the compounding effect on downstream delivery commitments — have typically multiplied the direct repair cost by a factor of three to five. The plants that break this cycle don't do it by hiring better technicians or keeping more spare parts on the shelf. They do it by shifting from reactive maintenance — fixing things after they break — to predictive maintenance, where data from the forklift itself tells the maintenance team what is going to fail, and when, before it happens. This guide walks through exactly how to implement predictive maintenance for forklift fleets in manufacturing environments, from the sensor data you need to the workflow changes that make it stick. Start your free FleetRabbit predictive maintenance trial or book a manufacturing fleet demo with our team.
FleetRabbit Predictive Maintenance
How to Reduce Forklift Downtime in Manufacturing Plants with Predictive Maintenance
A practical implementation guide for manufacturing plant managers and maintenance teams. Shift from reactive breakdown cycles to data-driven predictive maintenance that keeps production lines running and eliminates the hidden costs of unplanned forklift failures.
3–5×Indirect Cost Multiplier per Breakdown
62%Avg. Unplanned Downtime Reduction
Real-TimeFault Code Monitoring
WeeksEarlier Failure Detection
The True Cost of Reactive Forklift Maintenance
Most plant maintenance budgets account for parts and labour. Few account for the full cost of an unplanned forklift failure — and that gap is where the business case for predictive maintenance lives. When a forklift fails mid-shift, the direct repair cost is the smallest component of the total impact. Understanding the complete cost picture is the first step toward building internal support for the data infrastructure and workflow changes that predictive maintenance requires.
⏱
Production Line Delay
Every minute a forklift is unavailable is a minute the production line it serves is waiting for materials, components, or finished goods movement. In high-throughput manufacturing environments, line stoppage costs typically run between $2,000 and $8,000 per hour — costs that accumulate from the moment of breakdown, not from when the repair is completed.
?
Emergency Maintenance Premium
Unplanned repairs cost more than scheduled maintenance in every category: technician overtime rates rather than standard labour, expedited parts shipping rather than standard procurement, and the opportunity cost of pulling a technician off scheduled preventive work that now also slips. The total maintenance cost of an unplanned failure is typically 3–5 times the cost of the same repair performed on a planned schedule.
?
Schedule Recovery Cascade
A 45-minute forklift breakdown at 10 AM doesn't create a 45-minute delay — it creates a recovery cascade that extends across the shift and sometimes into the next. Supervisors reallocate tasks, operators make sub-optimal moves to compensate, throughput drops across the entire logistics operation, and overtime is incurred to recover schedule commitments that would have been met without the breakdown.
?
Accelerated Component Wear
Forklifts that fail due to deferred maintenance typically have secondary damage beyond the primary failure. A hydraulic hose that fails because early-stage leak signals were missed contaminates the hydraulic fluid, accelerates pump wear, and may damage cylinders — turning a $400 hose replacement into a $2,800 repair that includes fluid flush, filter replacement, and cylinder inspection. Predictive maintenance prevents the compounding.
The Four Data Signals That Predict Forklift Failures
Predictive maintenance is not about monitoring everything — it is about monitoring the right signals that have demonstrated predictive value for the specific failure modes that cause the most downtime in forklift fleets. There are four primary data categories that, when monitored continuously and trended over time, surface actionable maintenance signals weeks before a failure occurs.
01
Fault Code Frequency and Recurrence Patterns
Modern forklifts generate controller fault codes for dozens of conditions — from minor sensor variations to critical system warnings. The predictive signal is not in individual fault codes but in recurrence patterns: a fault code that fires, clears without repair, and fires again is a leading indicator of a component approaching failure, not a sensor glitch. FleetRabbit monitors fault code history for every asset, flags codes that recur within configurable time windows, and classifies them by predicted failure severity — distinguishing between monitor-and-watch conditions and schedule-now-before-it-fails alerts.
02
Operating Hour Accumulation vs. Maintenance Interval
Calendar-based maintenance scheduling fails forklift fleets because utilization varies enormously between assets, shifts, and seasons. A forklift running two production shifts accumulates maintenance-interval hours at twice the rate of a single-shift unit on the same calendar cycle — and reaches the failure-risk zone between service intervals when scheduled on calendar time rather than actual hours. FleetRabbit tracks actual operating hours per asset and triggers maintenance scheduling based on real utilization, not calendar approximations, ensuring high-utilization assets are never caught between service intervals when components are most vulnerable.
03
Hydraulic System Performance Indicators
Hydraulic system health is the most critical single indicator of forklift reliability in manufacturing environments because hydraulic failures affect lift capability, tilt control, and attachment function simultaneously. The early-stage signals — gradual drift in mast hold position, increasing cycle time for lift and lower operations, subtle changes in audible pump tone — are detectable through sensor monitoring and operator-reported pre-shift inspection data weeks before catastrophic hydraulic failure. FleetRabbit aggregates operator inspection reports with telematics data to build a hydraulic health trend line for each asset that flags deterioration before it becomes a breakdown.
04
Impact Event Accumulation and Severity Scoring
High-impact events — collisions, hard landings with loaded forks, aggressive mast operation — accelerate structural fatigue in ways that are invisible until a component fails under load. Individual impact events may be below the threshold for mandatory inspection, but cumulative impact scoring over time reveals assets that are accumulating structural stress at rates that predict earlier-than-expected structural failures. FleetRabbit scores impact events by severity, accumulates scores per asset over rolling time windows, and flags assets whose cumulative impact scores indicate elevated structural risk requiring inspection ahead of scheduled service.
FleetRabbit Predictive Maintenance Platform
From Reactive Breakdowns to Predicted Maintenance — Without Adding Headcount
FleetRabbit monitors fault codes, operating hours, inspection data, and impact events across your entire forklift fleet — automatically identifying the assets that are trending toward failure and surfacing them to your maintenance team with enough lead time to schedule repairs before production is impacted.
Implementation Roadmap: Four Phases to Predictive Maintenance
Most manufacturing plants that attempt predictive maintenance fail in implementation, not in concept. The failure mode is almost always the same: they invest in monitoring hardware, generate data, and then have no structured workflow to act on it. The following four-phase implementation roadmap addresses this by sequencing data collection, analysis, and workflow integration in the order that builds operational habits before complexity increases.
Phase 1
Baseline: Digitise Pre-Shift Inspections and Fault Code Capture
Before you can trend anything, you need a digital record of fleet condition at a consistent cadence. The foundation of predictive maintenance is digital pre-shift inspection data — structured, timestamped, and operator-attributed — combined with automated fault code capture from vehicle controllers. In Phase 1, deploy FleetRabbit's digital DVIR workflow to every forklift, eliminating paper inspection sheets that generate no searchable data. Simultaneously, connect telematics to capture fault codes automatically. Within 30 days, you have a baseline dataset of fleet condition across every shift.
Phase 2
Trending: Identify Asset-Level Deterioration Patterns
With 30–60 days of consistent inspection and fault code data, FleetRabbit's analytics begin generating asset-level health scores that trend deterioration over time. Maintenance managers review a weekly asset health report that ranks the fleet by maintenance risk — not by the calendar date of the last service, but by the actual condition signals the asset is generating. Phase 2 is complete when the maintenance team is using the health score report to sequence their weekly scheduled maintenance work, rather than scheduling by calendar interval alone.
Phase 3
Automation: Predictive Alerts and Work Order Generation
Phase 3 converts manual review into automated alerting. Configure FleetRabbit's predictive alert thresholds for each asset class: fault code recurrence windows, hydraulic performance deviation triggers, operating hour overrun alerts, and cumulative impact score thresholds. When an asset crosses a threshold, FleetRabbit automatically generates a maintenance work order, routes it to the appropriate technician, and flags the asset in the fleet dashboard with its current risk status. Maintenance now happens because the system detected a condition, not because a technician remembered to check or a calendar reminder fired.
Phase 4
Optimisation: Cost-Per-Hour Benchmarking and Fleet Right-Sizing
With 6+ months of condition data and maintenance cost records, Phase 4 applies fleet-level analysis. FleetRabbit's cost-per-operating-hour reporting identifies assets where total maintenance expenditure has crossed the economic replacement threshold — where continued investment in an aging asset exceeds the cost of replacement on a per-hour basis. This data converts forklift replacement decisions from budget negotiation into evidence-based business cases: specific assets, specific cost histories, specific projected savings from replacement. Phase 4 is where predictive maintenance moves from an operational tool to a capital planning input.
From the Plant Floor
"We were running eleven forklifts across two production shifts and averaging between two and three unplanned breakdowns per week. Every breakdown cost us somewhere between half a shift and a full shift of production disruption when you counted the ripple effects — not just the repair time. Our maintenance manager was spending more time responding to emergencies than doing any scheduled preventive work, which meant the preventive work kept slipping, which meant more breakdowns. It was a deteriorating cycle and we couldn't see a way out of it without adding headcount we didn't have budget for. We implemented FleetRabbit's predictive maintenance workflows in three phases over about ten weeks. The first thing that changed was visibility — our maintenance manager could see which assets were generating recurring fault codes for the first time, rather than only finding out about them when a driver reported a problem. In the first month, he caught a hydraulic pump showing early-stage pressure anomalies on two separate units and scheduled both for repair on the same day during a planned shutdown window. Neither unit failed in service. Six months in, our unplanned breakdown rate dropped from 2.4 per week to 0.6 per week. Production disruption from maintenance is down 71% and our total maintenance cost per operating hour is down 29% because we are doing repairs at the right stage rather than after secondary damage has compounded the problem."
Plant Manager
·
Precision Components Manufacturer — 11 Forklifts — FleetRabbit Predictive Maintenance Active
Frequently Asked Questions
QDo we need to replace our existing forklifts or install new hardware to use FleetRabbit predictive maintenance?
No. FleetRabbit connects to your existing forklift fleet through a combination of OBD-compatible telematics devices (for fault code capture and operating hour tracking), the mobile driver app (for digital pre-shift inspection data), and optional sensor retrofits for assets without native telematics outputs. For most modern forklifts — including Toyota, Crown, Hyster-Yale, and Jungheinrich models — telematics integration captures fault codes and operating hours without any hardware modification to the forklift itself. The telematics device installs in under 20 minutes per unit and begins transmitting data immediately. Older assets without controller integration use sensor-based monitoring for key parameters and the digital inspection workflow for condition trending. FleetRabbit is designed to work with mixed fleets of different ages, brands, and configurations without requiring fleet standardisation as a prerequisite.
QHow long does it take to see meaningful predictive data after deployment?
The first actionable data — fault code history, operating hour accumulation, and digital inspection records — is available from day one of deployment. Trending data that identifies deterioration patterns typically becomes meaningful after 3–4 weeks of consistent data collection per asset. The full predictive model, which generates asset-level health scores with statistical confidence, is operational after 6–8 weeks for most fleets. Plants that have existing paper inspection records can accelerate this timeline by importing historical fault code data from maintenance logs into FleetRabbit's baseline, giving the analytics engine a head start on deterioration pattern recognition. For fleets with prior telematics data in other formats, FleetRabbit's onboarding team supports data migration to preserve historical context.
QHow does FleetRabbit handle predictive maintenance across mixed fleets with different forklift brands?
FleetRabbit operates as a brand-agnostic platform across Toyota, Crown, Hyster, Yale, Jungheinrich, Linde, and Raymond forklifts simultaneously. The telematics integration layer normalises fault codes and operating data from different manufacturers into a standardised fleet health format, so maintenance managers see a unified risk ranking across the entire fleet regardless of brand mix. Brand-specific fault code libraries are maintained within the platform, so a Toyota fault code and a Crown fault code for the same underlying condition are classified consistently in the asset health model. For plants running both sit-down counterbalance forklifts and narrow-aisle reach trucks — which have different maintenance intervals, failure modes, and risk profiles — FleetRabbit maintains separate asset class models that apply the correct predictive logic to each equipment type.
QCan FleetRabbit integrate predictive maintenance alerts with our existing CMMS or ERP maintenance modules?
Yes. FleetRabbit provides API integration with major Computerised Maintenance Management Systems including Fiix, UpKeep, Limble, Maintenance Connection, and IBM Maximo, as well as SAP PM and Oracle EAM maintenance modules. When FleetRabbit generates a predictive maintenance alert, it can automatically create a work order in your existing CMMS — populating asset ID, fault description, recommended action, priority level, and the supporting data that triggered the alert — without requiring a technician to manually re-enter the information. Work order completion status and parts consumption data flow back from the CMMS to FleetRabbit, updating the asset's maintenance history and recalibrating its health score based on the repair performed. For plants that prefer to manage work orders directly in FleetRabbit rather than through a separate CMMS, the platform includes native work order creation, assignment, and tracking functionality.
FleetRabbit Predictive Maintenance
Stop Reacting to Breakdowns. Start Preventing Them.
FleetRabbit gives manufacturing plant maintenance teams the fault code monitoring, operating hour tracking, digital inspection data, and automated alert workflows to shift from reactive breakdown cycles to predictive maintenance that keeps production lines running — without adding headcount or replacing existing forklifts.
Predictive Maintenance
Fault Code Monitoring
Digital DVIR
Asset Health Scoring
CMMS Integration
Downtime Reduction
May 22, 2026
By Taylor
All Posts