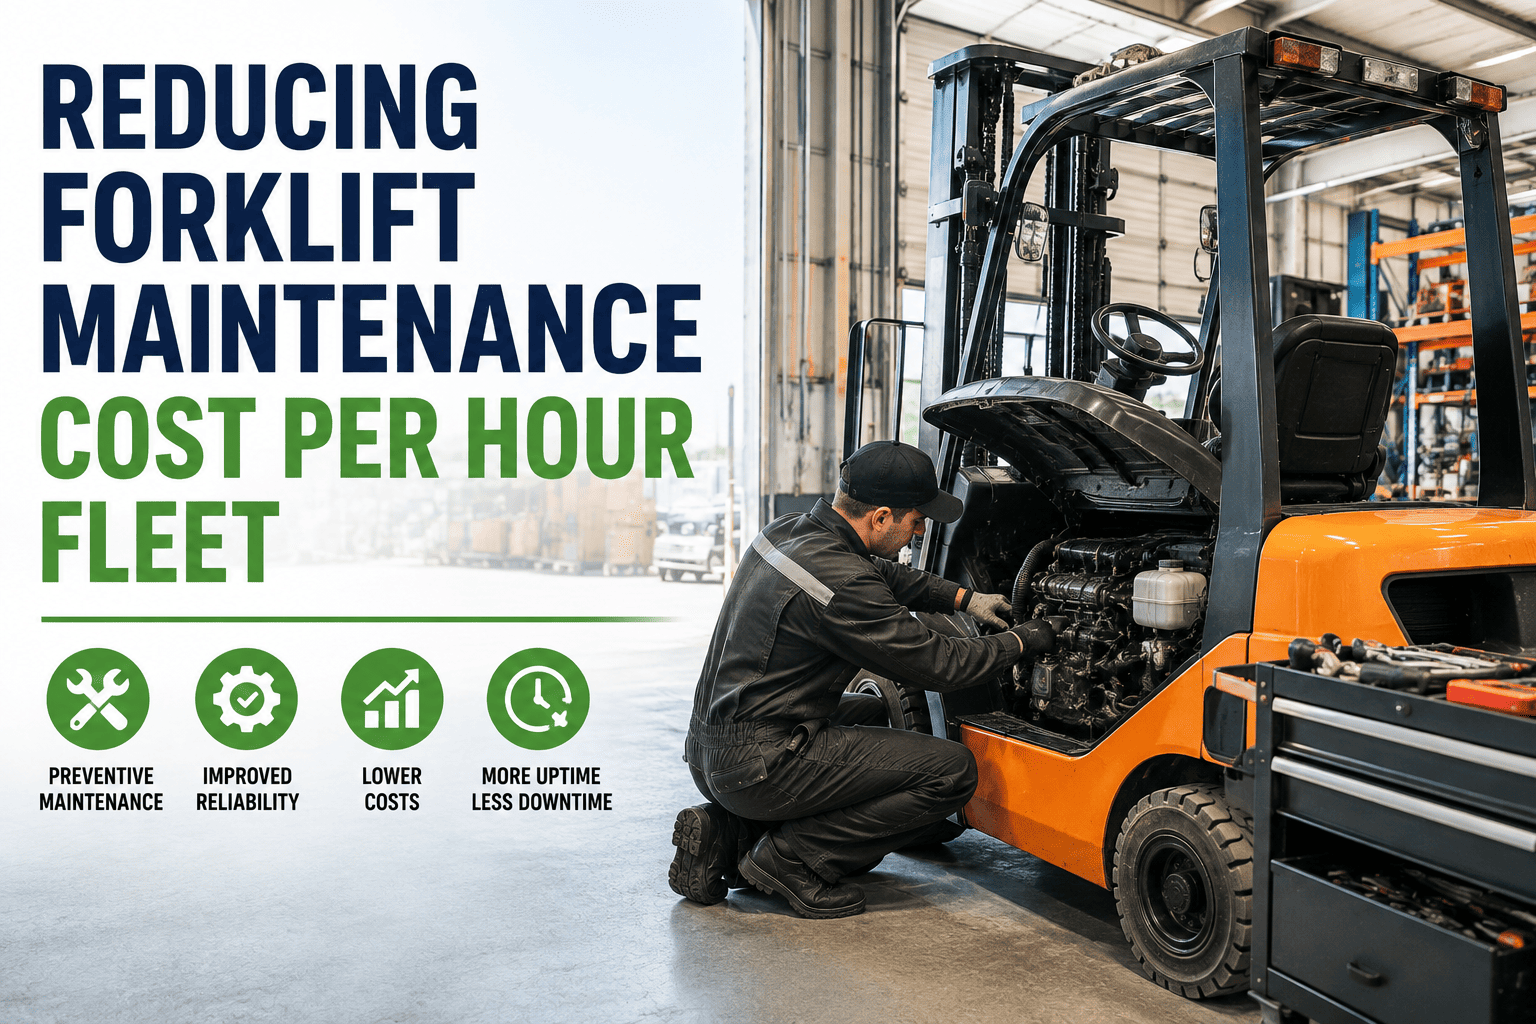
Ask ten fleet managers what their forklifts cost to maintain and most will point to an annual budget number. Ask them what that comes out to per operating hour, broken down truck by truck, and the room usually goes quiet. Yet cost per hour is the one number that actually tells you whether a forklift is aging gracefully or quietly turning into a money pit, because it adjusts for the one variable that matters most: how much the truck is actually being used.
Forklift maintenance cost per hour is calculated by dividing total maintenance spend (parts, labor, and service contracts) for a truck by its total operating hours over the same period. Industry benchmarks typically run 15 to 25 dollars per hour for internal combustion forklifts and 10 to 20 dollars per hour for electric models. Tracking this figure per truck, rather than as a fleet-wide average, is what surfaces the individual units dragging the whole fleet's cost up.
The Formula, And Why It Beats A Flat Annual Number
The math itself is simple: total maintenance cost divided by total operating hours for the same truck over the same period. What makes it powerful is what it controls for. A truck that cost 4,000 dollars to maintain last year sounds expensive until you learn it ran 2,000 hours across three shifts, putting it at exactly 2 dollars per hour, well inside a healthy range. A truck that cost half that but only ran 200 hours is the one actually bleeding money.
Where Your Fleet Should Land
Benchmarks vary by power source, application, and truck age, but they give you a starting point to judge your own numbers against instead of guessing.
Reading Your Number Against The Benchmark
A truck sitting well above its benchmark range isn't automatically a lost cause, but it is a signal to look closer. Age, application severity, and how much of its history has been reactive versus planned all shift where a truck should reasonably land. The goal isn't to force every truck to the bottom of the range; it's to know which trucks are outliers and why.
FleetRabbit automatically calculates cost per hour by truck, pulling parts, labor, and service data into one number you can actually act on. Sign up free and see your first three trucks scored today.
What Actually Drives Cost Per Hour Up
Four factors explain most of the spread between a well-managed fleet and one bleeding money on maintenance. Understanding which one is dragging a specific truck down tells you exactly where to intervene.
How Cost Per Hour Compares Across Common Maintenance Approaches
The maintenance strategy behind a truck has a direct, measurable effect on where its cost per hour ends up. The table below lays out the general pattern fleets see when comparing approaches.
| Maintenance Approach | Typical Cost Per Hour Impact | Why |
|---|---|---|
| Purely Reactive | Highest, often at the top or beyond benchmark range | Emergency labor, expedited parts, and unplanned downtime all carry a cost premium |
| Calendar-Only PM | Moderate, but inconsistent across the fleet | Over-services low-use trucks while under-servicing high-use ones |
| Hour-Based PM | Lower, and more consistent truck to truck | Service timing matches actual wear, reducing both waste and surprise failures |
| Predictive / Condition-Based | Lowest achievable range | Issues are caught and resolved before they escalate into costlier repairs |
A Note On Comparing Trucks Fairly
When comparing cost per hour across your own fleet, group trucks by power source and application first. Comparing an outdoor diesel yard truck directly against an indoor electric truck will make one look artificially expensive even if both are performing well for their role.
Six Ways To Bring The Number Down
Once you know which trucks are running high, these are the levers that move cost per hour in the right direction without requiring a full fleet replacement.
Most of these changes don't require new equipment, just better visibility into data most fleets already generate but rarely consolidate. If you want to see where your own fleet's outliers sit before committing to a bigger maintenance overhaul, a quick demo call is usually the fastest way to find out.
Frequently Asked Questions
FleetRabbit turns scattered parts, labor, and hour-meter data into a clear cost-per-hour score for every truck in your fleet, so you know exactly where to focus. Book a demo to see your fleet's outliers, or sign up and start tracking today.