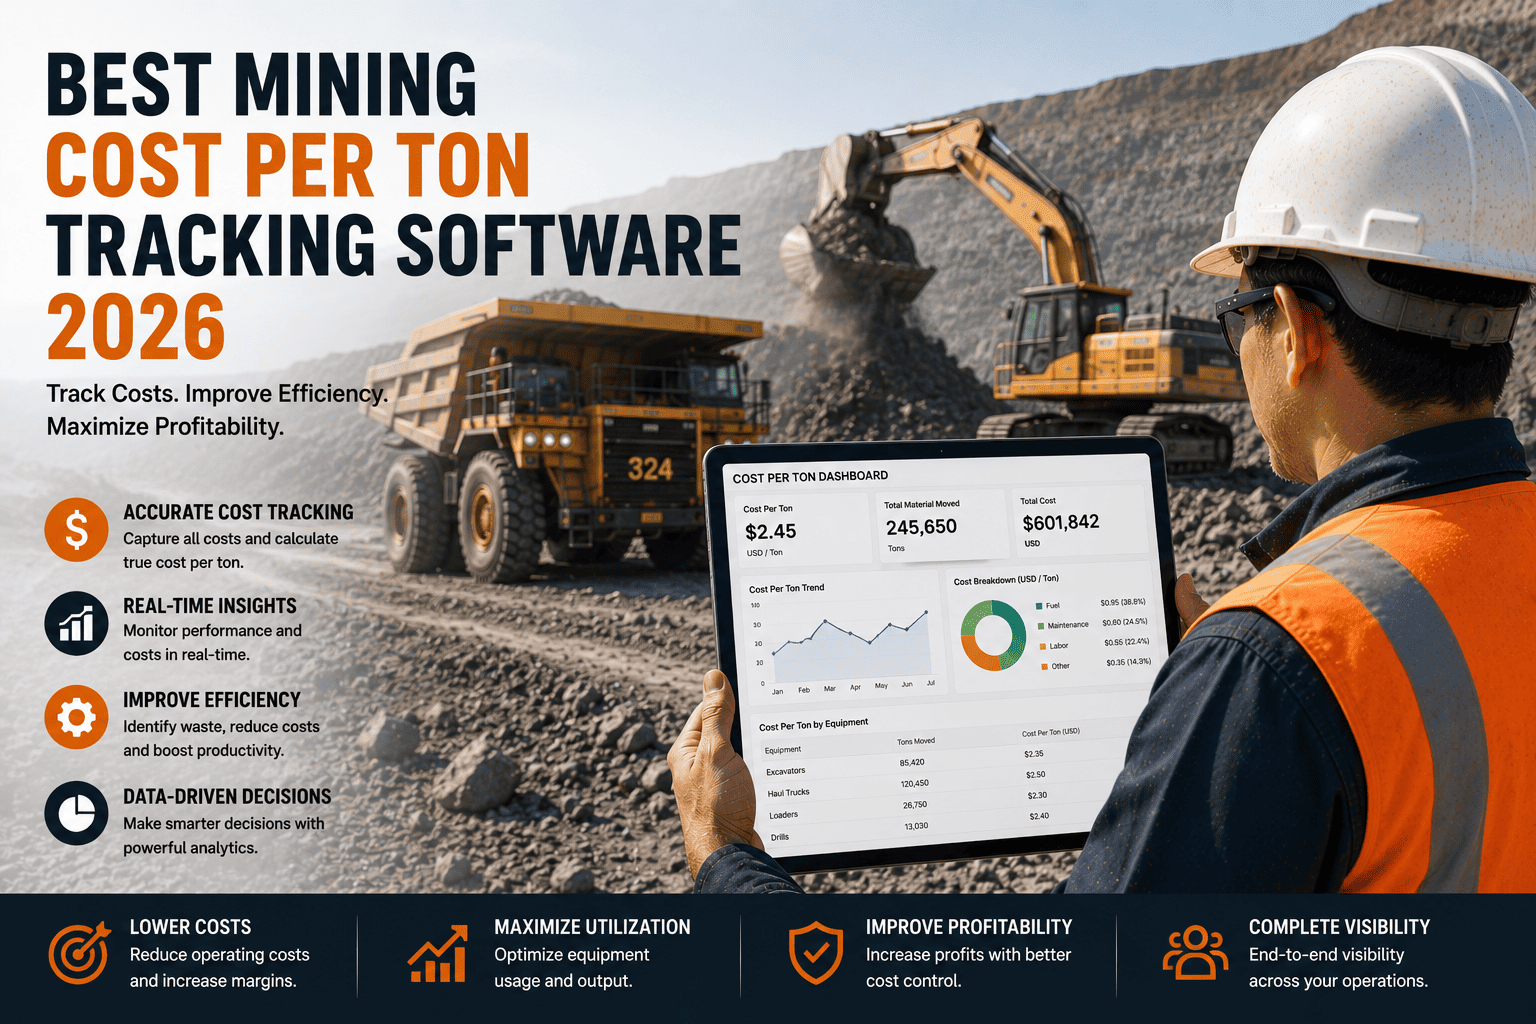
Ask most mine managers what it actually costs to move a ton of material today, right now, not last month's report, and you'll get a pause instead of a number. Fuel, maintenance, depreciation, and idle time all live in separate systems, which means cost per ton gets calculated after the fact, once a month, long after the decisions that drove it are already locked in. Real-time cost per ton tracking software closes that gap by turning scattered data into one live number you can act on during the shift, not after it.
The best mining cost per ton tracking software combines fuel consumption, maintenance spend, depreciation, and haul cycle data into one live cost-per-hour and cost-per-ton figure, updated as equipment operates rather than reconstructed at month-end. Operations using this kind of real-time tracking commonly cut total operating costs by up to 28 percent by catching idle time, fuel waste, and inefficient hauling while there's still time to fix it. Sign up for FleetRabbit to see your fleet's cost per ton calculated automatically.
What Actually Makes Up Your Cost Per Ton
Cost per ton isn't one number, it's several rolled together, and the mines that manage it well are the ones tracking each component separately before combining them. Every haul truck, loader, and excavator carries its own fuel, maintenance, and depreciation profile, and utilization data is what turns those separate figures into a single cost-per-hour number that drives repair-or-replace decisions.
Fuel: The Fastest-Moving Number
Fuel usage responds quickly to route efficiency, idle time, and haul road condition. Advanced fuel tracking commonly reduces total fuel usage by up to 15 percent through idle reduction, consumption anomaly alerts, and route optimization.
Maintenance and Depreciation: The Slower-Moving Numbers
These costs shift less shift to shift but compound over months if left unmanaged. Rolling fuel, maintenance, and depreciation into one fully-loaded cost-per-hour figure per asset is what makes the number useful for capital decisions, not just budget tracking.
Haul Cycle Efficiency Ties It All Together
Cost per ton ultimately comes down to how much material moves per hour of operating cost. A well-maintained haul road alone can improve cycle efficiency by 10 to 15 percent, meaning the same truck moves more tons for the same fuel and labor spend.
FleetRabbit rolls fuel, maintenance, and depreciation into one live cost-per-hour figure for every haul truck, loader, and excavator, no manual spreadsheet reconciliation required. Start your free trial and see the number populate automatically.
Where the Money Actually Leaks Out of Your Cost Per Ton
Most operations lose money in the same handful of places, and each one shows up clearly once you're tracking cost per ton in real time instead of reconstructing it after the fact.
| Cost Leak | Why It Happens | Typical Impact | What Real-Time Tracking Catches |
|---|---|---|---|
| Idle Equipment | Machines sit engine-on waiting on a loader, haul road clearance, or dispatch delay | Thousands of dollars annually per truck in wasted fuel and wages | Automatic alerts the moment an asset sits idle past a set threshold |
| Fuel Reconciliation Gaps | Purchased fuel and actual consumption tracked in separate, disconnected systems | 8 to 10 percent variance between what's bought and what's burned | Real-time consumption data reconciled against purchases, cutting variance below 1 percent |
| Payload Inconsistency | Loads vary shift to shift instead of running consistently at target capacity | Up to 30 to 35 percent higher haulage fuel consumption | Load and cycle data compared per truck to flag inconsistent payloads |
| Poor Haul Road Condition | Rolling resistance forces engines to work harder than necessary | 10 to 15 percent lower cycle efficiency | Cycle time trends by route that flag when road maintenance is overdue |
Turning Raw Data Into a Live Cost-Per-Ton Number
The mines seeing real results aren't running a more complicated spreadsheet, they're running one dashboard that updates as equipment operates. Utilization, idle time, and fully-loaded cost per hour populate automatically as machines report activity through the shift, instead of waiting for someone to compile it at month-end.
What the Dashboard Actually Needs to Show
Real-time availability across the fleet so you know which machines are ready to work, fuel and maintenance rolled into one figure per asset for repair-or-replace decisions, and operating hours versus available hours per shift so underused equipment gets spotted before it drains the budget.
Cost Per Ton Follows Naturally From Utilization Data
Once you know how long each asset actually worked and what it cost to run, dividing that against tons moved gives you a cost-per-ton figure grounded in real operating data rather than a monthly estimate built on assumptions.
FleetRabbit surfaces idle time, utilization, and true cost per hour automatically, with no manual log review needed. Book a demo and see how quickly a real-time cost-per-ton view comes together for your fleet.
Getting a Live Cost Per Ton Dashboard Running
Setting this up doesn't require a data team or a months-long configuration project. A typical 15-asset operation can get fully live within a single business day once equipment is listed and cost inputs are entered.
Start With What You Already Track
List every haul truck, loader, and excavator with current engine hours, importing from a CSV or connecting existing telematics hardware rather than starting from a blank slate.
Add the Numbers That Turn Hours Into Dollars
Enter fuel cost, maintenance budget, and depreciation per asset type so the dashboard can calculate true cost-per-hour automatically, then set idle-time thresholds so dispatch gets alerted the moment a machine sits unproductive.
FAQ: Mining Cost Per Ton Tracking Software
Every shift without live cost tracking is a shift where fuel waste, idle time, and inconsistent payloads quietly erode your margin. FleetRabbit turns fuel, maintenance, and utilization data into one live cost-per-ton figure, so you can act during the shift instead of after it. Start your free trial today, no credit card required.







