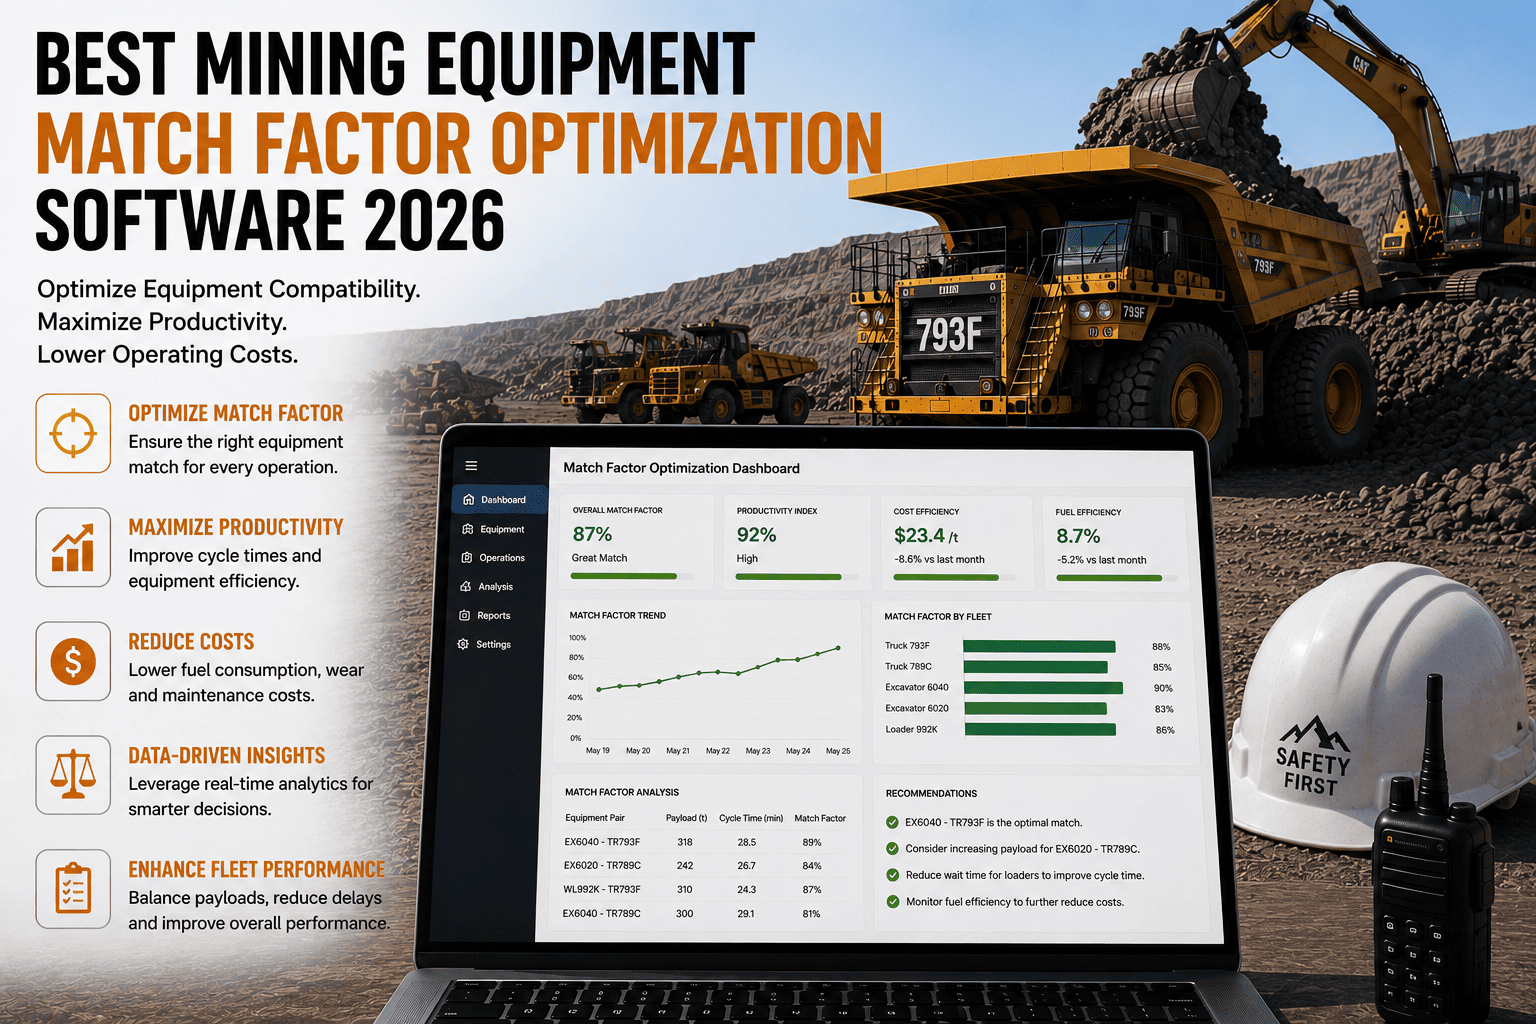
Walk onto any open-pit mine site and you'll see it within minutes: a shovel standing idle waiting for the next haul truck, or a line of trucks queued up behind a loader that can't fill them fast enough. Both scenarios burn money every single shift. The ratio that explains why this happens, and how to fix it, is called the equipment match factor, and getting it right is one of the highest-leverage decisions a mining operation can make.
Match factor is the ratio of truck arrival rate to loader service rate. A value near 1.0 means your loaders and haul trucks are balanced. Below 0.5 means loaders sit idle waiting for trucks. Above 1.0 means trucks queue and wait on loaders. Mining fleets running match factor optimization software typically recover 10 to 20 percent more productive cycle time without buying a single extra truck.
What Equipment Match Factor Actually Measures
Match factor compares how fast trucks show up at the loading point against how fast the loader can fill them. In its simplest homogeneous-fleet form it's calculated as the number of trucks multiplied by the loader's cycle time, divided by the truck's cycle time multiplied by the number of loading passes needed to fill one truck. Mines running mixed fleets, different truck sizes paired with different shovel classes, need a heterogeneous version of the same formula, because a single loader-truck ratio rarely tells the whole story once haul distances, grades, and truck payloads start to vary across the pit.
Why a "Good Enough" Fleet Ratio Isn't Good Enough
Most mines set their truck-to-loader ratio once, based on a mine plan built months earlier, and then leave it alone. But haul distances change as the pit deepens, road conditions shift with weather, and truck availability drops as machines age. A ratio that produced a match factor of 1.0 last quarter can quietly drift to 0.6 or 1.4 without anyone noticing until the monthly production report comes in short. Signing up for a free trial gives your team a live match factor dashboard instead of a lagging one.
The Real Cost of an Unbalanced Fleet
An idle loader still burns fuel, still accrues wear on its undercarriage, and still requires an operator on the clock, all while moving zero material. A queued truck burns diesel at idle, adds engine hours with no payload benefit, and stretches the whole cycle time for every truck behind it. Neither cost shows up as a single dramatic breakdown. It shows up as a mine that consistently produces 10 to 20 percent less tonnage than its equipment fleet is actually capable of moving.
FleetRabbit tracks cycle times, queue minutes, and loader utilization across every pit face in real time, then recommends the truck allocation that keeps match factor as close to 1.0 as your terrain allows. Start a free trial with 3 vehicles and see your current match factor today.
Signs Your Fleet Is Out of Balance
You don't need a spreadsheet to sense that something is off at the pit, but you do need data to know exactly how much it's costing you and which shift or which loader is the source. These are the patterns that show up first.
| Warning Sign | What It Looks Like | Likely Match Factor Zone | Fix |
|---|---|---|---|
| Loader Sitting Idle | Shovel finishes digging and waits with a full bucket, no truck positioned | Below 0.5, under-trucked | Add a truck to that loading unit or shorten the haul cycle |
| Truck Queue Forming | Two or more trucks stacked behind the loader with engines running | Above 1.0, over-trucked | Reassign a truck to a different loading unit or pit face |
| Rising Fuel Burn Per Ton | Fuel costs climb without a matching rise in tons hauled | Either extreme | Recalculate match factor after any haul road or grade change |
| Shift Production Variance | Day shift hits target, night shift consistently falls short | Shifts independently unbalanced | Set shift-specific truck allocation instead of one fixed ratio |
How Match Factor Optimization Software Works
Modern optimization platforms replace the once-a-quarter manual recalculation with continuous, automated tracking pulled directly from equipment telematics and GPS positioning. Instead of estimating cycle times from an old time-and-motion study, the software measures them from every single cycle, every truck, every shift.
Real-Time Cycle Time Capture
GPS and telematics data from loaders and trucks feed the software actual load time, haul time, dump time, and return time as they happen. This replaces static assumptions with live numbers that reflect today's haul road conditions, not last quarter's.
Automatic Match Factor Calculation
Rather than someone running the formula in a spreadsheet once a month, the platform recalculates match factor continuously for every loader-truck pairing across the pit, flagging any loading unit that drifts outside the balanced zone.
Dynamic Truck Reallocation Recommendations
When a loading unit trends toward under-trucked or over-trucked, the software recommends reassigning a specific truck, rerouting a haul path, or adjusting dispatch priority so the fleet self-corrects before a full shift of production is lost.
Dashboard Visibility for Every Level of the Operation
Pit supervisors see match factor by loading unit in real time. Fleet managers see it rolled up by shift and by pit. Executives see the tonnage and cost impact translated into dollars. Booking a demo is the fastest way to see how this looks against your own fleet data.
What Balanced Fleets Actually Deliver
Mines that actively manage match factor rather than setting it once and forgetting it see the improvement show up in three places: more tons moved per operating hour, lower fuel cost per ton, and fewer loader and truck hours wasted on queueing or waiting.
Getting Started With Match Factor Optimization
The first step is simply seeing your current numbers. Most mines are surprised to learn their match factor swings well outside the balanced zone during certain shifts or at certain pit faces, even when overall monthly production looks acceptable on paper. A short trial period against your own telematics data is usually enough to show exactly where the imbalance is hiding and what it's costing in lost tonnage.
From there, the software takes over the ongoing work: tracking every cycle, recalculating match factor continuously, and recommending truck reallocation before an imbalance turns into a full shift of lost production. You can start a free trial to connect your existing fleet data, or book a short demo if you'd rather walk through it with a member of the team first.
Every shift your loaders and trucks run out of sync is tonnage you can't get back. FleetRabbit tracks match factor continuously and tells you exactly which loading unit needs a truck reassigned, before the imbalance costs you the shift.







