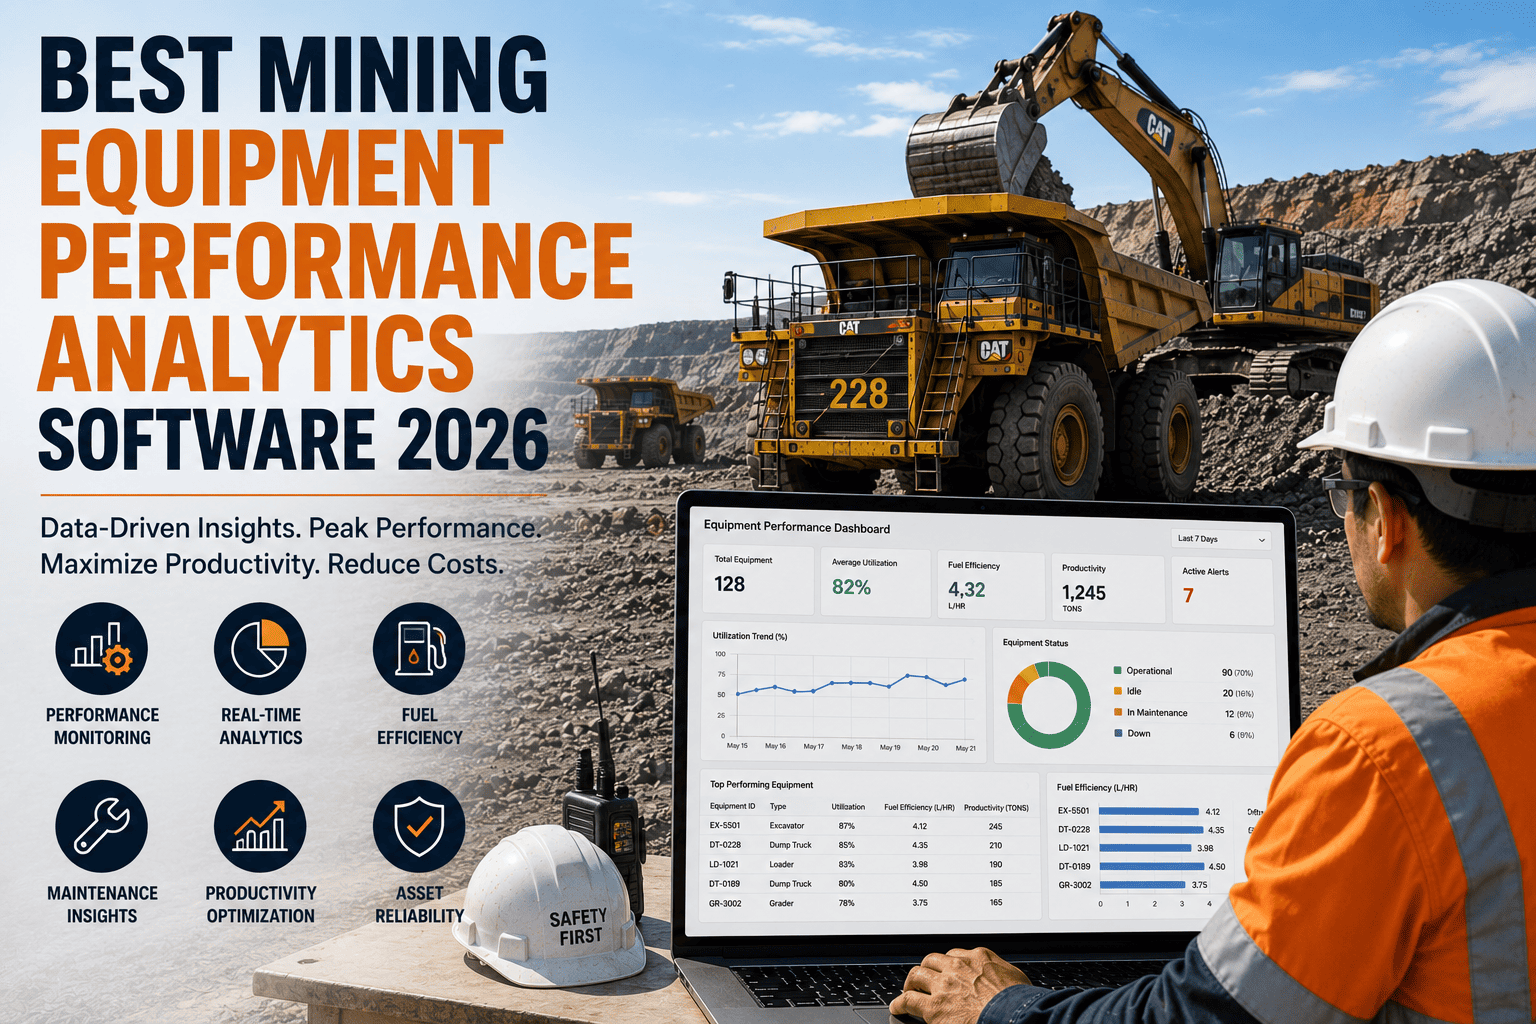
Two haul trucks can log the exact same number of hours on shift and still deliver wildly different results. One moves 30 percent more material because the operator manages cycle times well and the machine rarely sits idle waiting on a shovel. The other looks identical on an hours report but is quietly dragging down fleet-wide output. Mining equipment performance analytics software is what surfaces that difference, turning raw hours and tonnage data into a clear picture of which assets and operators are actually performing and which ones need attention.
The best mining equipment performance analytics software breaks fleet performance into availability, utilization, and performance efficiency, then benchmarks every asset and operator against industry targets. World-class fleets exceed 85 percent Overall Equipment Effectiveness, while many mining operations run closer to 60 to 65 percent, leaving real room for improvement. Sign up for a free trial or book a demo to see where your fleet stands.
The Three Numbers Behind Every Performance Score
Overall Equipment Effectiveness, or OEE, is the single number that matters most in mining equipment performance analytics, and it is built from three components that each tell a different part of the story.
What The Combined Number Actually Reveals
Multiply availability, utilization, and performance efficiency together and you get OEE. A recent study at a large copper mine found shovels operating at an average OEE of just 25 percent and dump trucks at 38 percent, a wide gap from the 85 percent-plus that defines world-class performance. That gap represents real, addressable upside sitting in dispatch decisions and operator technique rather than new equipment purchases.
Why A Single Number Is Not Enough On Its Own
An OEE score of 65 percent tells you almost nothing by itself. Compared to what? Analytics software answers that by placing your number next to an industry benchmark, your own historical trend, and other assets or operators running similar equipment under similar conditions.
FleetRabbit tracks availability, utilization, and performance efficiency continuously, then benchmarks every truck, loader, and shovel against industry targets so you know exactly which metric to fix first.
How Analytics Software Actually Finds Your Underperforming Assets
Raw hours-worked reports hide the exact problems fleet managers need to see. Purpose-built analytics platforms translate that raw data into specific, actionable signals.
| Signal Tracked | What It Reveals | Action It Triggers |
|---|---|---|
| Cycle Time Variance | One truck taking noticeably longer per haul cycle than similar units | Flags a route, technique, or mechanical issue worth investigating |
| Idle-To-Working Ratio | Equipment spending too much scheduled time waiting rather than producing | Points to dispatch or queuing bottlenecks rather than equipment problems |
| Payload Consistency | Loads consistently under or over target capacity | Highlights loading technique issues that waste cycles or risk overloading |
| Operator-Level Trends | Performance differences between operators running the same equipment | Identifies coaching opportunities instead of blaming the machine |
| Fleet-Wide Ranking | Which specific assets sit furthest below the fleet average | Prioritizes where maintenance or dispatch attention pays off first |
Operator Efficiency: The Lever Most Fleets Overlook
It is tempting to treat every performance gap as a machine problem, but two operators running the same haul truck on the same route regularly produce different tonnage. Performance analytics software isolates that variable by comparing operators against each other on identical equipment and routes, not just against a fleet-wide average.
Spotting The Gap Between Top And Bottom Performers
When operator-level data is visible, the gap between the top and bottom quartile of operators on the same machine often reveals more recoverable tonnage than any single equipment upgrade would. That gap is usually a training and coaching opportunity, not a hardware problem.
Turning Data Into Coaching, Not Blame
The goal of operator analytics is not to single anyone out. Sharing cycle time and efficiency trends with crews directly, alongside recognition for top performers, tends to close the gap faster than a purely top-down directive ever does.
Benchmarks Worth Tracking Every Week
Availability should sit between 85 and 95 percent for a well-maintained fleet. Utilization, the share of available time actually spent producing, should land between 70 and 85 percent. Combined OEE above 85 percent marks world-class performance, while the 60 to 65 percent industry average signals meaningful room to improve. Tracking these three numbers weekly, by asset and by operator, turns a vague sense that "something feels off" into a specific, fixable target.
FleetRabbit ranks assets and operators against fleet averages and industry targets automatically, so the biggest opportunity for improvement is obvious instead of buried in a spreadsheet.
Frequently Asked Questions
Key Takeaways
Mining equipment performance analytics software earns its place by breaking a vague sense of underperformance into three specific, trackable numbers: availability, utilization, and performance efficiency. Fleets running at the 60 to 65 percent industry average have real, addressable upside compared to the 85 percent-plus that defines world-class performance, and most of that gap sits in dispatch decisions, idle time, and operator technique rather than equipment age. Ranking assets and operators against each other turns that upside into a specific, prioritized action list instead of a hunch.
If your fleet reports are still just hours worked and tonnage moved, it is worth seeing what a real performance breakdown looks like on your own equipment. Sign up for a free trial to see your current OEE score, or book a short demo and walk through your fleet's specific benchmarks with the FleetRabbit team.
FleetRabbit breaks every truck, loader, and operator into availability, utilization, and performance efficiency, then ranks them against industry benchmarks so the biggest opportunity is obvious. See your fleet's real OEE score this week.







