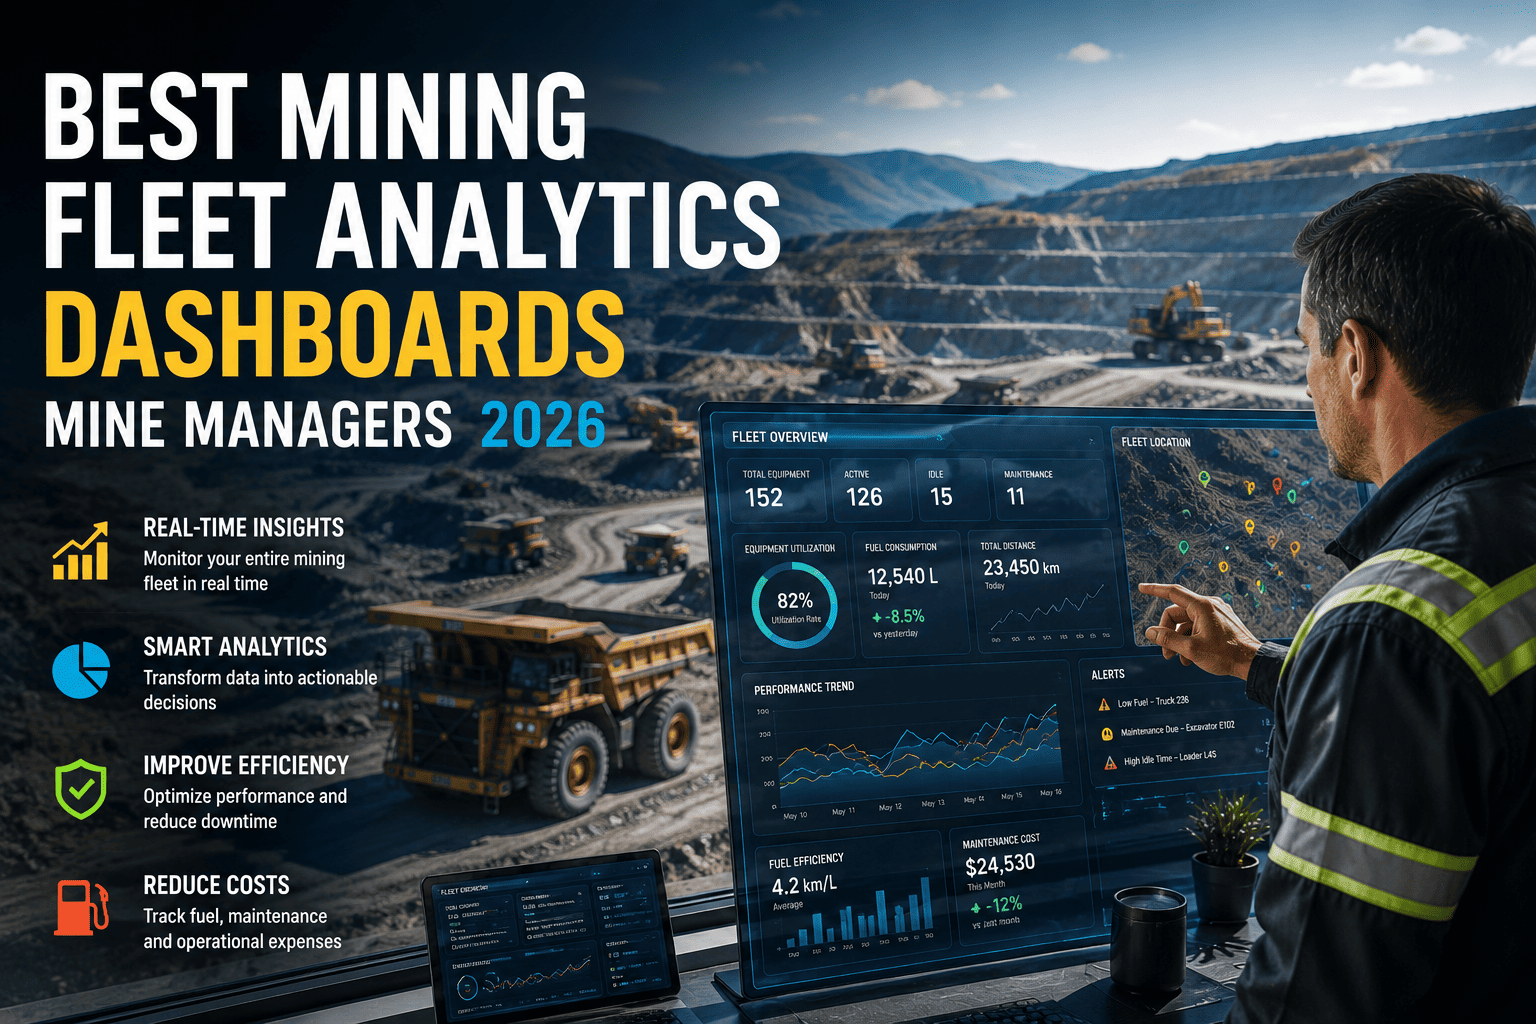
Mining fleet analytics dashboards have become the essential command center for modern mine managers. But with so many options on the market—from enterprise-grade suites to lightweight tracking tools—choosing the right one can feel overwhelming. This guide cuts through the noise, comparing the top mining fleet analytics dashboards available in 2026, breaking down the KPIs that actually move the needle on cost control, and showing how FleetRabbit delivers true visibility without the complexity or cost of traditional enterprise systems. Whether you manage a 10-truck quarry or a 50-asset mine, the insights here will help you make a smarter, data-backed decision.
Mine Manager's Guide to Fleet Analytics
Top Mining Fleet Analytics Dashboards Every Mine Manager Should Use in 2026
If you manage a haul truck fleet, you know that raw GPS location tells you almost nothing about whether a machine is earning its keep. A dashboard that shows real-time availability, cost per hour, and production output isn't a luxury—it's the difference between budgeting with confidence and guessing where your operating budget leaks. This guide compares the leading mining fleet analytics dashboards, breaks down the KPIs that actually drive cost control, and shows how FleetRabbit gives mine managers true visibility without the complexity of enterprise systems.
FleetRabbit AI surfaces idle time, utilization, and fully-loaded cost-per-hour for every haul truck, loader, and excavator—automatically. No manual log review. Setup in under a day.
What a Great Mining Dashboard Shows You
Top mining fleet analytics dashboards don't just show you where equipment is—they show you whether it's working, how much it's costing, and where you're losing money. The best ones make these five metrics instantly visible:
Real-time availability across your fleet, so you know exactly which machines are ready to work and which are down.
Fuel, maintenance, and depreciation rolled into one figure per asset—the number that drives repair-or-replace decisions.
Operating hours vs. available hours, per shift and per asset, so you can spot underused machines before they drain budget.
Operations using automated utilization tracking typically cut total operating costs by up to 28% within the first year.
FleetRabbit vs. Enterprise Analytics vs. Generic Trackers
Not all dashboards are built for mining. Here's how the options stack up on the metrics that matter to mine managers.
| Capability | FleetRabbit AI | Enterprise Mining Analytics | Generic Equipment Trackers |
|---|---|---|---|
| Idle vs. active hours per asset | Automatic, real-time | Yes, requires BI config | Basic or limited |
| Cost-per-hour reporting (fully loaded) | Built-in, auto-calculated | Custom reports, BI team needed | Rarely included |
| Engine-hour maintenance triggers | Automatic via telematics sync | Complex configuration | Calendar-based only |
| Production output per asset | Included standard | Enterprise tier only | Not typically available |
| Trend reporting over time | Week/month views built in | Dashboard-dependent | Limited history |
| Setup time | Same day, self-serve | 3-6 months, consultants | 1-2 weeks |
| Monthly pricing | $5 per asset | $3,000 – $15,000+ | $200 – $900 |
| Built for small to mid-size mines | Purpose-built | Enterprise focus | Generic adaptation |
*Comparison based on industry analysis and FleetRabbit feature set.
The Metrics That Actually Drive Cost Control
A dashboard is only as good as the KPIs it tracks. Here are the four most critical metrics every mining analytics dashboard should surface—and why they matter for your budget.
What it is: Operating time divided by available time, per shift and per asset.
Why it matters: A machine that sits idle for 15-20% of engine-on hours is burning fuel and accruing maintenance with zero production. Utilization tracking exposes this instantly.
FleetRabbit: Automatic idle-time alerts flag any asset exceeding a set threshold, so dispatch can redeploy or shut down equipment before cost accumulates.
What it is: Fully loaded cost—fuel, scheduled maintenance, depreciation, and repairs—divided by operating hours.
Why it matters: This single number tells you whether an aging excavator is still worth keeping, or if it's time to replace it with a newer model.
FleetRabbit: Calculated automatically per asset, updated continuously, no spreadsheet required.
What it is: Productive time (tons moved, cycles completed) divided by operating time.
Why it matters: High utilization doesn't always mean high productivity. A truck that's constantly moving but underloaded is still a cost leak.
FleetRabbit: Production output per asset is shown alongside operating hours, so you can see true efficiency at a glance.
What it is: Preventive maintenance scheduled based on actual operating hours, not calendar dates.
Why it matters: Calendar-based PM wastes parts on low-utilization machines and risks breakdowns on high-utilization ones. Engine-hour based PM reduces unexpected downtime by up to 42%.
FleetRabbit: Automatic maintenance triggers pull directly from utilization tracking, so every PM happens at the correct interval for that asset.
From Zero Visibility to a Live Dashboard in One Day
Most mine managers delay adopting analytics because they assume it requires a data team and months of configuration. With FleetRabbit, it doesn't. Here's how a typical 15-asset operation gets fully live within a single business day.
List every haul truck, loader, and excavator with current engine hours. Import from a CSV or connect existing telematics hardware.
Enter fuel cost, maintenance budget, and depreciation per asset type so the dashboard can calculate true cost-per-hour automatically.
Set how long an asset can sit engine-on without activity before it triggers an alert to dispatch or the site manager.
Utilization, idle time, and cost-per-hour begin populating on the dashboard immediately as equipment reports activity through the shift.
Within a day, the dashboard typically surfaces at least one clear pattern—a machine idling more than expected, or a cost-per-hour figure higher than assumed—giving you your first data-backed decision instead of a hunch.
Idle haul trucks get reassigned within minutes instead of sitting unnoticed for a full shift. Maintenance budgets shrink because PM happens at the right interval instead of too early or too late. Fleet-sizing conversations shift from opinion to evidence. And when it's time to decide whether to repair or replace an aging excavator, the answer is sitting on a dashboard instead of buried in someone's memory of how the machine "felt" last quarter.
FleetRabbit AI turns idle time, cost-per-hour, and production output into a live dashboard for every asset on your site. No manual reconciliation. No waiting for a quarterly review to find the leak. Setup takes less than a day. 14-day free trial. No credit card. No contracts.
Beyond the Dashboard: How Fleet Analytics Reshapes Maintenance & Capital Planning
While a live dashboard gives you immediate visibility, the real value of fleet analytics compounds over time. Data that flows consistently from utilization tracking feeds into two areas where mining budgets often hemorrhage: maintenance scheduling and capital replacement decisions. Here's how advanced analytics turns raw numbers into long-term cost control.
Calendar-based maintenance is a relic of the pre-telematics era. A haul truck that runs 12 hours a day wears differently than one that runs 6. Yet most operations still service both on the same schedule. Fleet analytics that tracks engine hours per asset enables maintenance triggers that are specific to each machine's actual workload.
Result: Fewer parts wasted on low-utilization equipment, fewer breakdowns on high-utilization equipment, and a maintenance budget that aligns with reality instead of a calendar.
The decision to replace an aging excavator or haul truck is one of the biggest financial calls a mine manager makes. Without utilization and cost-per-hour trends, that decision is often based on a mechanic's opinion or a manager's memory of recent breakdowns. With a dashboard that shows cost-per-hour trending upward over 12 months, the decision becomes clear long before the machine becomes a liability.
Result: Capital is deployed on equipment that actually needs replacing, not on machines that "feel old." Fleet expansion is based on utilization gaps, not guesses.
Frequently Asked Questions About Mining Fleet Analytics
Idle equipment, oversized fleets, and calendar-based maintenance all quietly drain mining budgets—and they all show up clearly once utilization is tracked automatically. FleetRabbit AI surfaces idle time, cost-per-hour, and production output for every asset on one live dashboard, set up in under a day for $5 per asset per month. No credit card required for the 14-day free trial. No long-term contracts. No data team needed.







