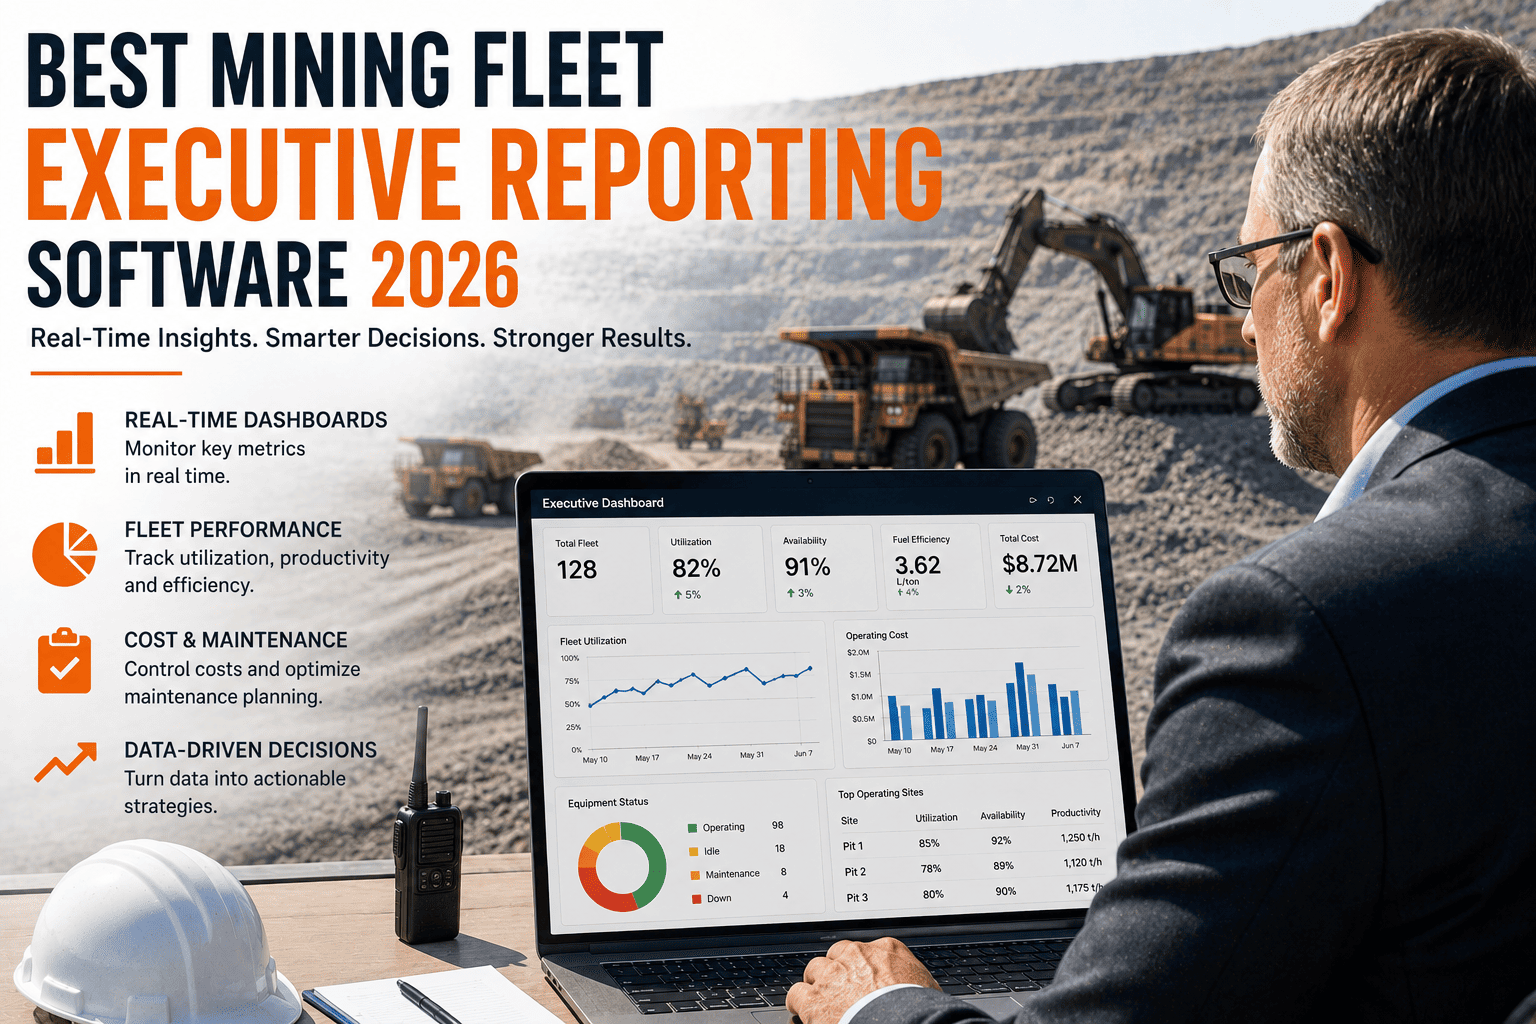
Every Friday afternoon, somewhere on your team, someone is exporting data from three or four systems and stitching it into a slide deck for Monday's leadership meeting. By the time it lands in an executive's inbox, the numbers are already days old, and half the meeting gets spent debating whose spreadsheet is right instead of deciding what to do next. That's the quiet tax most mining operations pay for not having real executive reporting software, and it's bigger than most leadership teams realize.
Mining fleet executive reporting software automatically pulls fleet, maintenance, and cost data into live dashboards and scheduled reports, so leadership sees accurate KPIs the same day they happen instead of in a Friday-built slide deck. Operations using automated executive reporting typically cut report preparation time by 80 percent and catch cost or downtime trends 2 to 3 weeks earlier than manual review cycles allow.
Why Manual Executive Reporting Breaks Down
Most mining operations don't lack data, they lack a way to turn it into something leadership can trust and act on quickly. The data sits scattered across telematics, maintenance logs, fuel cards, and dispatch systems, and someone has to manually pull it all together every single week.
Stale By Monday
A report built Friday from last week's exports is already outdated by the time leadership reviews it, so decisions get made on numbers that no longer reflect reality.
Hours Lost to Assembly
Ops managers routinely spend four to six hours a week exporting, cleaning, and formatting data into slides instead of acting on what the numbers show.
Numbers That Don't Match
When every department calculates utilization or downtime a little differently, meetings turn into arguments over whose spreadsheet is correct instead of what to fix.
No Room to Drill Down
A static slide shows the headline number but not which site, shift, or asset is actually driving it, leaving executives with a summary and no way to ask the next question.
See Your Executive Numbers Live, Not On A Delay
FleetRabbit turns scattered fleet, maintenance, and cost data into automated executive dashboards and scheduled reports, so leadership always sees the current picture. Sign up free and connect your first report in minutes.
What Executive Reporting Software Actually Delivers
Good executive reporting software isn't just a prettier chart. It removes the manual assembly step entirely, so the report leadership sees is generated straight from live operational data, not rebuilt by hand every cycle.
Automated Weekly and Monthly Reports
Reports generate on a schedule and land directly in the right inboxes, pulling current numbers automatically instead of waiting on someone to compile them.
Why scheduling beats requesting
When a report has to be requested, it gets deprioritized under other work. When it arrives automatically every Monday morning, it becomes part of how leadership actually runs the business.
Role-Based Dashboard Views
A site manager, a maintenance lead, and a CFO all care about different numbers. Executive reporting software shows each of them the view relevant to their decisions, from the same underlying data.
Scorecards Across Every Pillar
The strongest reports balance four areas at once rather than obsessing over one, since a problem in one pillar usually shows up as a symptom in another.
Manual Reporting vs Automated Executive Reporting
The gap between building reports by hand and having them generated automatically becomes obvious once you line the two approaches up side by side.
| Factor | Manual Spreadsheet Reporting | Automated Executive Reporting |
|---|---|---|
| Time to Prepare | 4 to 6 hours weekly per report | Zero, generated and delivered automatically |
| Data Freshness | Days old by the time it's reviewed | Live or same-day, updated continuously |
| Consistency | Varies by who built it and how | Standardized calculations every time |
| Drill-Down Ability | Static, one summary view only | Click into site, shift, or asset level detail |
| Trend Detection | Only visible after several manual cycles | Flagged automatically as patterns emerge |
Building a Reporting Cadence Leadership Will Actually Use
A dashboard nobody checks and a report nobody reads are both wasted effort. The operations getting real value from executive reporting build a simple rhythm around it instead of treating it as a one-time project.
Site-Level Check
Supervisors glance at availability and idle-time alerts to catch anything that needs same-shift action.
Operations Review
Ops leads review utilization, PM compliance, and cost-per-hour trends across sites in one automated summary.
Executive Scorecard
Leadership reviews the full four-pillar scorecard, comparing performance against targets and prior months.
Strategic Planning
Longer trend data informs budget decisions, replacement planning, and where to invest next.
One Data Source, A Different View For Every Role
FleetRabbit gives supervisors, ops leads, and executives role-based dashboards built from the same live data, so nobody is working from a different set of numbers. Book a demo to see the executive view built around your actual fleet.
Choosing the Right Reporting Platform
Confirm It Connects to What You Already Use
The platform should pull directly from your existing telematics, fuel cards, and maintenance systems rather than asking your team to re-enter data into yet another tool.
Check How Fast the First Report Appears
A strong platform should surface a usable dashboard within hours of connecting your data, not after weeks of configuration and consulting calls.
Ask Whether It Prevents Dashboard Fatigue
The best reporting tools highlight a small number of headline KPIs prominently and keep everything else one click deep, instead of dumping thirty metrics onto a single screen that nobody actually reads.
Frequently Asked Questions
Key Takeaways
Manual executive reporting isn't just slow, it quietly shapes worse decisions because leadership is always reacting to numbers that are already out of date. Automated reporting turns that Friday scramble into a live, standardized view that every level of your team can trust and act on the same day. The operations pulling ahead aren't the ones with the most data, they're the ones who can actually see it in time to use it.
Stop Building Reports By Hand Every Week
FleetRabbit automatically turns your fleet, maintenance, and cost data into live executive dashboards and scheduled reports, no spreadsheets, no Friday scramble. Try it free on your own fleet today, no credit card required.







