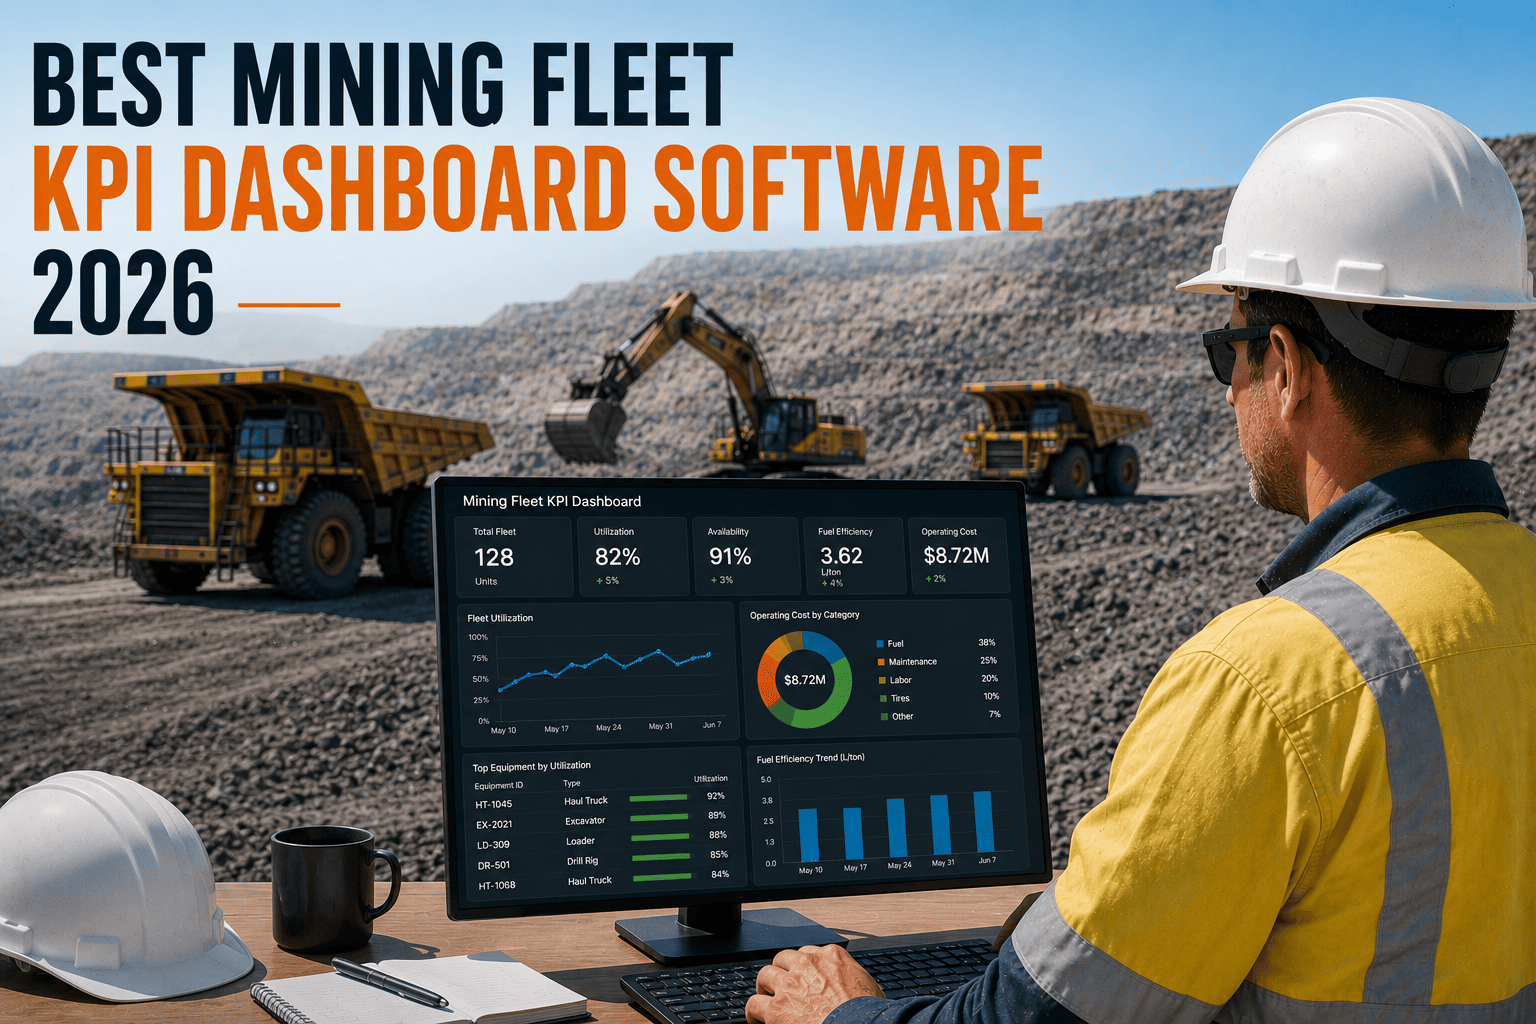
Ask five mine managers how their fleet performed last shift and you'll usually get five different answers, pulled from five different systems, none of them fully in sync. One is looking at yesterday's telematics export, another is going off a gut feeling from walking the pit, and a third is still waiting on a report that won't land until Friday. A real KPI dashboard fixes that by putting one live number in front of everyone, updated the moment it changes rather than the next time someone builds a spreadsheet.
Mining fleet KPI dashboard software pulls telematics, maintenance, and cost data into one live view, tracking equipment utilization, availability, cost per hour, fuel consumption, and maintenance compliance automatically. Sites using a real-time KPI dashboard typically spot performance drops within a shift instead of a reporting cycle later, closing the gap between average and best-in-class performance far faster than manual review.
The 5 KPIs Every Mining Fleet Dashboard Should Track
A dashboard drowning in forty metrics gets ignored within a week. The dashboards that actually get used every day narrow the main screen down to a handful of numbers that drive real decisions, with everything else available one click deeper.
Equipment Utilization
Productive operating hours divided by available hours, per shift and per asset, showing which machines are actually earning their place in the fleet.
Fleet Availability
The percentage of scheduled time each asset is mechanically ready to work, the number operations leadership watches most closely for planning.
Cost Per Operating Hour
Fuel, maintenance, and depreciation rolled into one figure per asset, the single number that drives most repair-or-replace decisions.
Fuel Consumption
Gallons or liters burned per operating hour or per tonne moved, exposing waste from idling, poor routing, or engine issues before it compounds.
PM Compliance
The share of scheduled maintenance completed on time, the metric that separates a proactive fleet from one heading toward unplanned breakdowns.
Your First KPI Dashboard, Ready Within A Day
FleetRabbit pulls utilization, availability, cost per hour, fuel, and PM compliance into one live dashboard, no manual log review required. Sign up free and see your fleet's real numbers today.
What a Live Mining KPI Dashboard Actually Looks Like
The best dashboards show headline numbers large at the top, with color and scale doing the work of a full-page report. Here's a simplified look at how those five KPIs sit together on a single screen.
Why Layout Matters As Much As Data
Two dashboards can pull from identical data and still deliver completely different results depending on whether the important numbers are visible in three seconds or buried three clicks deep.
Real-Time Dashboards vs Traditional Fleet Reporting
The shift from periodic reports to a live dashboard changes more than how fast information arrives, it changes what decisions are even possible.
| Factor | Traditional Reporting | Live KPI Dashboard |
|---|---|---|
| Update Frequency | Daily or weekly, manually compiled | Continuous, updates as data arrives |
| Problem Detection | Found during the next review cycle | Flagged the same shift it occurs |
| Data Source | Exported and merged by hand | Connected directly to telematics and maintenance systems |
| Accessibility | One static document shared after the fact | Available anytime on desktop or mobile |
| Drill-Down | Limited to what was printed or exported | Click into asset, shift, or pit-level detail instantly |
Avoiding Dashboard Overload
More metrics doesn't mean more insight. A dashboard that shows thirty numbers with equal visual weight forces every user to do the work of figuring out what actually matters, and most stop looking within weeks.
Lead With a Handful of Headline KPIs
Utilization, availability, cost per hour, fuel consumption, and PM compliance belong at the top of every screen, sized larger than anything else on the page.
Push Everything Else One Click Deep
Diagnostic metrics like idle time breakdowns, driver behavior, or work order aging are valuable, but they belong behind a drill-down, not competing for attention on the main view.
The test for whether a metric belongs on the main screen
If a number doesn't trigger a specific action when it moves, it likely belongs deeper in the dashboard rather than on the front page everyone checks first.
Build Role-Based Views
A dispatcher needs different numbers than a maintenance lead or an executive. The strongest dashboards show each of them a version built around their actual decisions, from the same underlying data.
The Right Numbers, In The Right Place, For Every Role
FleetRabbit surfaces the five KPIs that matter most at the top, with drill-down detail available whenever you need it. Book a demo to see it built around your fleet's roles and shifts.
Getting a Live Dashboard Running on Your Fleet
Rolling out a KPI dashboard doesn't require a data team or a months-long project. Most operations follow a similar short path from raw data to a working, trusted dashboard.
Connect Existing Data
Link current telematics hardware, fuel cards, and maintenance records so the platform starts calculating KPIs from data you already collect.
Set Cost and Threshold Inputs
Enter fuel cost, maintenance budget, and idle-time thresholds per asset type so the dashboard calculates true cost per hour automatically.
Configure Role-Based Views
Set up dashboard versions for dispatch, maintenance, and leadership so each team sees the numbers relevant to their decisions.
Watch The First Pattern Emerge
Within days, the dashboard usually surfaces a clear signal, an asset idling more than expected or a cost-per-hour figure higher than assumed, giving you a data-backed decision instead of a guess.
Frequently Asked Questions
Key Takeaways
A mining fleet generates plenty of data every shift, the real gap is almost never information, it's visibility. A live KPI dashboard turns scattered telematics, maintenance, and cost data into a handful of numbers your whole team can trust and act on the same shift they change, instead of a report built days later from memory and exports. The fleets pulling ahead of their peers aren't running newer equipment, they're the ones who can see their numbers in time to use them.
Stop Waiting On Reports To See Your Fleet's Numbers
FleetRabbit turns your telematics, maintenance, and cost data into one live KPI dashboard, tracking utilization, availability, cost per hour, fuel, and maintenance compliance automatically. Try it free on your own fleet today, no credit card required.







