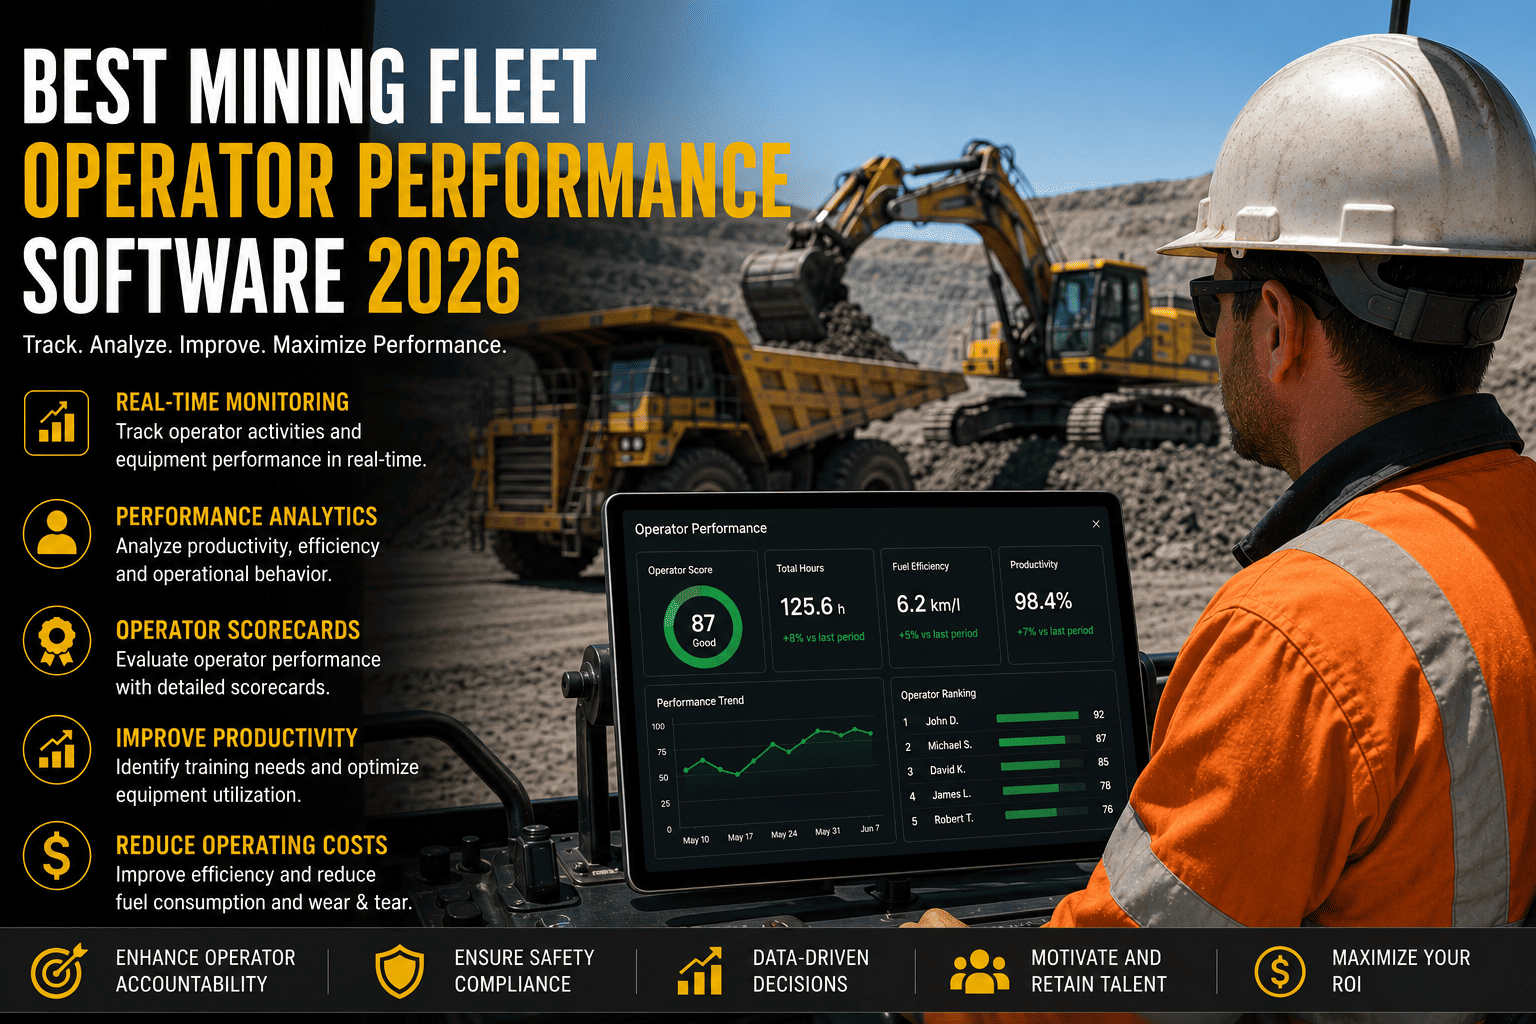
Two operators run identical haul trucks on the same route, same shift, same load. One burns noticeably less fuel, hits fewer proximity alerts, and wears through tires slower than the other. Same machine, same road, very different cost to the operation. That gap is operator behavior, and it's one of the largest levers a mine has on safety and profitability that most fleets still aren't measuring. Operator performance software turns that invisible gap into a scorecard every driver can see, act on, and improve, shift after shift.
The best mining fleet operator performance software tracks safety indicators like seatbelt compliance and speed exceedances, fuel efficiency per cycle, idle time, and cycle-time consistency, then rolls it into a per-operator scorecard used for coaching. Powered haulage and machinery account for roughly 65 percent of U.S. mining fatalities, which is why leading operations pair real-time behavior data with structured coaching instead of relying on end-of-shift reports. Mines using this approach commonly see meaningful gains in fuel efficiency and a measurable drop in at-risk driving events within months.
Why Operator Behavior Moves the Numbers More Than the Machine Does
It's tempting to treat haul trucks as interchangeable units of capacity, but the person behind the controls has a direct hand in fuel burn, tire wear, cycle time, and safety outcomes every single shift. A truck's fuel-per-tonne creeping above its baseline is often the first sign of a driving pattern problem, not a mechanical one, and it shows up in the data weeks before anyone would notice it by eye.
The Safety Case Is Impossible to Ignore
Powered haulage and machinery-related incidents account for roughly 65 percent of U.S. mining fatalities in recent MSHA data, which puts mobile equipment operation at the center of any serious safety program. Leading indicators like pre-shift inspection completion, seatbelt compliance, and speeding events give supervisors a chance to intervene before an at-risk behavior becomes an incident, rather than reading about it afterward in a report.
FleetRabbit combines safety, fuel, and productivity data into one per-operator scorecard, so supervisors can coach with specifics instead of guesswork. Sign up free to see your operator scorecards in minutes, or book a demo to walk through a live example.
The Metrics a Real Operator Scorecard Should Track
A scorecard is only useful if it measures things an operator can actually control and a supervisor can act on the same day. These are the categories that matter most in mobile mining equipment.
| Metric Category | What It Measures | Why It's a Leading Indicator |
|---|---|---|
| Seatbelt & Pre-Shift Compliance | Whether required safety steps were completed before operation | Directly tied to injury prevention on powered haulage equipment |
| Speed & Proximity Events | Speeding incidents and collision-warning triggers per operating hour | Flags risky behavior before it becomes an incident |
| Fuel Burn Per Cycle | Fuel consumed relative to load, route, and cycle count | Reveals driving style differences worth real fuel savings at scale |
| Idle Time Per Shift | Engine-on time with no productive movement | A common, fixable drag on both fuel cost and cycle output |
| Cycle Time Consistency | Load, haul, dump, and return time compared across shifts | Separates skilled, consistent operators from those needing coaching |
Building a Coaching Program Operators Actually Respond To
A scorecard nobody looks at changes nothing. The mines getting real results pair the data with a coaching rhythm that treats operators as partners in the outcome, not subjects of surveillance.
Share the Data With the Operator, Not Just the Supervisor
Programs that give drivers routine access to their own performance data, rather than keeping it in a manager's office, consistently produce better engagement. Operators who can see exactly where they stand tend to self-correct driving habits well before a formal coaching conversation happens.
Benchmark Against Peers, Not Just a Fixed Target
A percentile ranking against similar trucks on similar routes tells an operator something a flat target can't. Being in the bottom quartile for fuel efficiency on an identical route is a much clearer signal than a generic company-wide number that ignores route and load differences.
Turn Outliers Into Same-Shift Conversations
When a truck shows a sudden spike in fuel consumption or an unusual pattern of proximity alerts, that's most useful the same day, while the shift and the specifics are still fresh, not three weeks later in a monthly review.
Recognize Improvement, Not Just Flag Problems
Scorecard programs that highlight top performers alongside the ones needing coaching build buy-in faster than a system that only ever surfaces bad news, and operators are more likely to trust data that's clearly being used fairly.
FleetRabbit flags outlier behavior the moment it happens and ranks operators against comparable routes and loads, so coaching conversations are specific and fair. Start free and put your fleet's scorecards to work, or book a demo to see how coaching workflows fit your shifts.
What Results Look Like Once Scorecards Are in Place
Operator performance programs consistently move three numbers that matter directly to the bottom line.
Fuel Efficiency
Coaching driving behavior around load handling, speed, and idle habits commonly delivers fuel efficiency gains in the high single digits to low double digits per truck, which compounds quickly across a large haul fleet.
At-Risk Driving Events
Operations that pair real-time proximity and speed data with structured coaching typically see a steady decline in at-risk events per operator over a few months, as drivers adjust habits in response to visible, specific feedback.
Tire and Component Life
Smoother, more consistent driving reduces the load spikes and harsh braking that wear down tires and drivetrain components faster than expected, extending replacement intervals on some of the most expensive consumables in the fleet.
Frequently Asked Questions
The same machine, driven differently, can mean the difference between a safe, efficient shift and a costly one. FleetRabbit turns that difference into a clear, per-operator scorecard your supervisors can act on today. Start free or book a walkthrough with our team.







