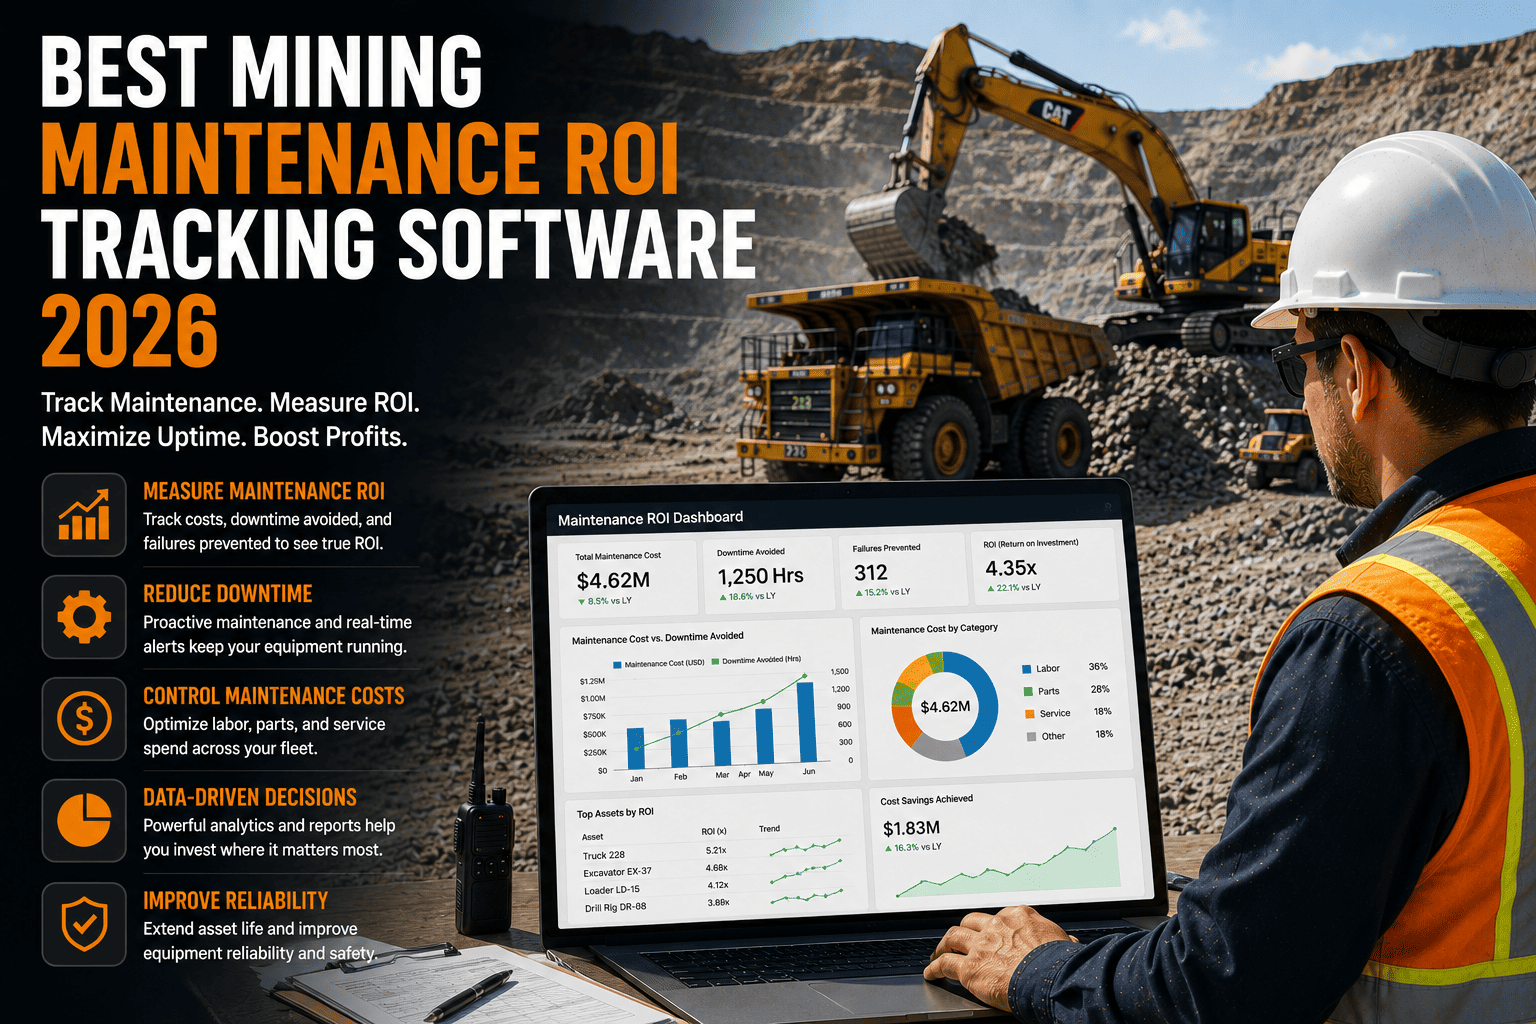
Ask most mining maintenance managers what their maintenance program actually returns in dollars, and the honest answer is usually a guess. Work orders live in one spreadsheet, parts spend lives in another, and downtime gets logged wherever there's time to log it. Mining maintenance ROI tracking software fixes that by connecting cost, downtime, and repair data to every asset automatically — so when leadership asks whether the maintenance budget is working, you have a number instead of a shrug. This guide breaks down the KPIs that actually prove ROI and how FleetRabbit tracks them by asset in real time. Start a free trial to see your own fleet's numbers, or book a demo to walk through it live.
Most maintenance ROI inaccuracy comes from inconsistent data entry, not bad software — technicians skipping failure codes, generic notes like "fixed," and reporting logged hours after the work was done. Mining operations tracking maintenance by asset in a connected platform typically shift from 50 to 70 percent unplanned repairs toward the 80 to 20 planned-to-unplanned ratio considered healthy, turning maintenance spend from a cost center into a number you can defend in a budget review.
Spend Lives in Three Different Sheets
By the Time You See It, It's Old News
No Number to Defend the Budget With
Why Mining Maintenance ROI Is So Hard to Prove
Most maintenance inaccuracy has nothing to do with the software itself. It comes from technicians skipping failure codes, writing generic notes instead of specific fault categories, and closing out work orders long after the repair actually happened. Inconsistent definitions of what even counts as downtime across shifts compound the problem, so two supervisors on the same site can report completely different numbers for the same week.
A connected maintenance ROI platform fixes the root cause, not just the symptom. Standardized failure codes, mandatory fields on every work order, and automated data capture from the moment a technician opens a job remove the guesswork before it ever reaches a report.
See What Every Asset Actually Costs You
FleetRabbit connects work orders, parts spend, and downtime hours to every haul truck, excavator, and drill automatically, so maintenance ROI is a live number instead of a quarterly estimate. Start a free trial and see your own fleet's numbers today.
The KPIs That Actually Prove Maintenance ROI
Maintenance KPI programs work best built around three to five core metrics, not twenty. Teams tracking too many indicators fall into analysis paralysis, spending more time managing dashboards than managing equipment. These are the metrics that matter most for proving mining maintenance ROI.
| KPI | What It Measures | Healthy Target | Why It Proves ROI |
|---|---|---|---|
| Planned vs. unplanned ratio | Share of maintenance that's scheduled vs. emergency | 80% planned / 20% unplanned | Shows whether spend is going toward prevention or firefighting |
| Mean Time to Repair (MTTR) | Average time to fix a failed asset | Trending down quarter over quarter | Directly ties maintenance efficiency to recovered production hours |
| Mean Time Between Failures (MTBF) | Average interval between breakdowns per asset | Trending up quarter over quarter | A rising MTBF is the clearest proof preventive spend is working |
| Cost per asset | Total labor, parts, and downtime cost per unit | Benchmarked against asset class averages | Flags which specific trucks or excavators are draining the budget |
| PM compliance rate | Percentage of scheduled PMs completed on time | 95% or higher | Low compliance today predicts high emergency spend next quarter |
How FleetRabbit Turns Maintenance Data Into ROI You Can Show Leadership
FleetRabbit connects work orders, parts inventory, and asset downtime into one live dashboard, so every KPI above updates the moment a technician closes a job — not at the end of the month.
Real-Time KPI Tracking by Asset, Shift, and Zone
MTTR, MTBF, technician performance, and overdue tasks are visible in real time, by line, team, or asset, so a developing cost problem is caught before it turns into a missed target.
Standardized Data Capture Removes the Guesswork
Mandatory failure codes and structured fields on every work order mean the ROI report leadership sees is built on clean data, not on whatever a technician remembered to type.
One Dashboard Instead of Three Spreadsheets
Cost, downtime, and repair history for every asset live in a single view, replacing the manual reconciliation that eats a maintenance manager's week before every budget cycle.
Turn Your Maintenance Budget Into a Business Case
Book a 30-minute demo and see exactly how FleetRabbit's dashboard configurations map to your fleet, so your next budget review comes with proof instead of a guess.
Key Takeaways on Mining Maintenance ROI Tracking Software
Proving maintenance ROI isn't about collecting more data — it's about collecting the right five metrics consistently, by asset, in real time. The gap between a maintenance budget that's a guess and one that's a business case comes down to whether your platform connects cost, downtime, and repair history automatically, or leaves it to spreadsheets stitched together once a quarter.
FleetRabbit closes that gap for surface and underground mining fleets alike, turning every work order into a data point your next budget review can stand on.
Stop Guessing What Your Maintenance Budget Returns
FleetRabbit connects work orders, parts spend, and downtime to every asset automatically, so maintenance ROI is a live number your team can defend, not a quarterly estimate. Start your free trial today, or book a 30-minute demo to see your own dashboard.







