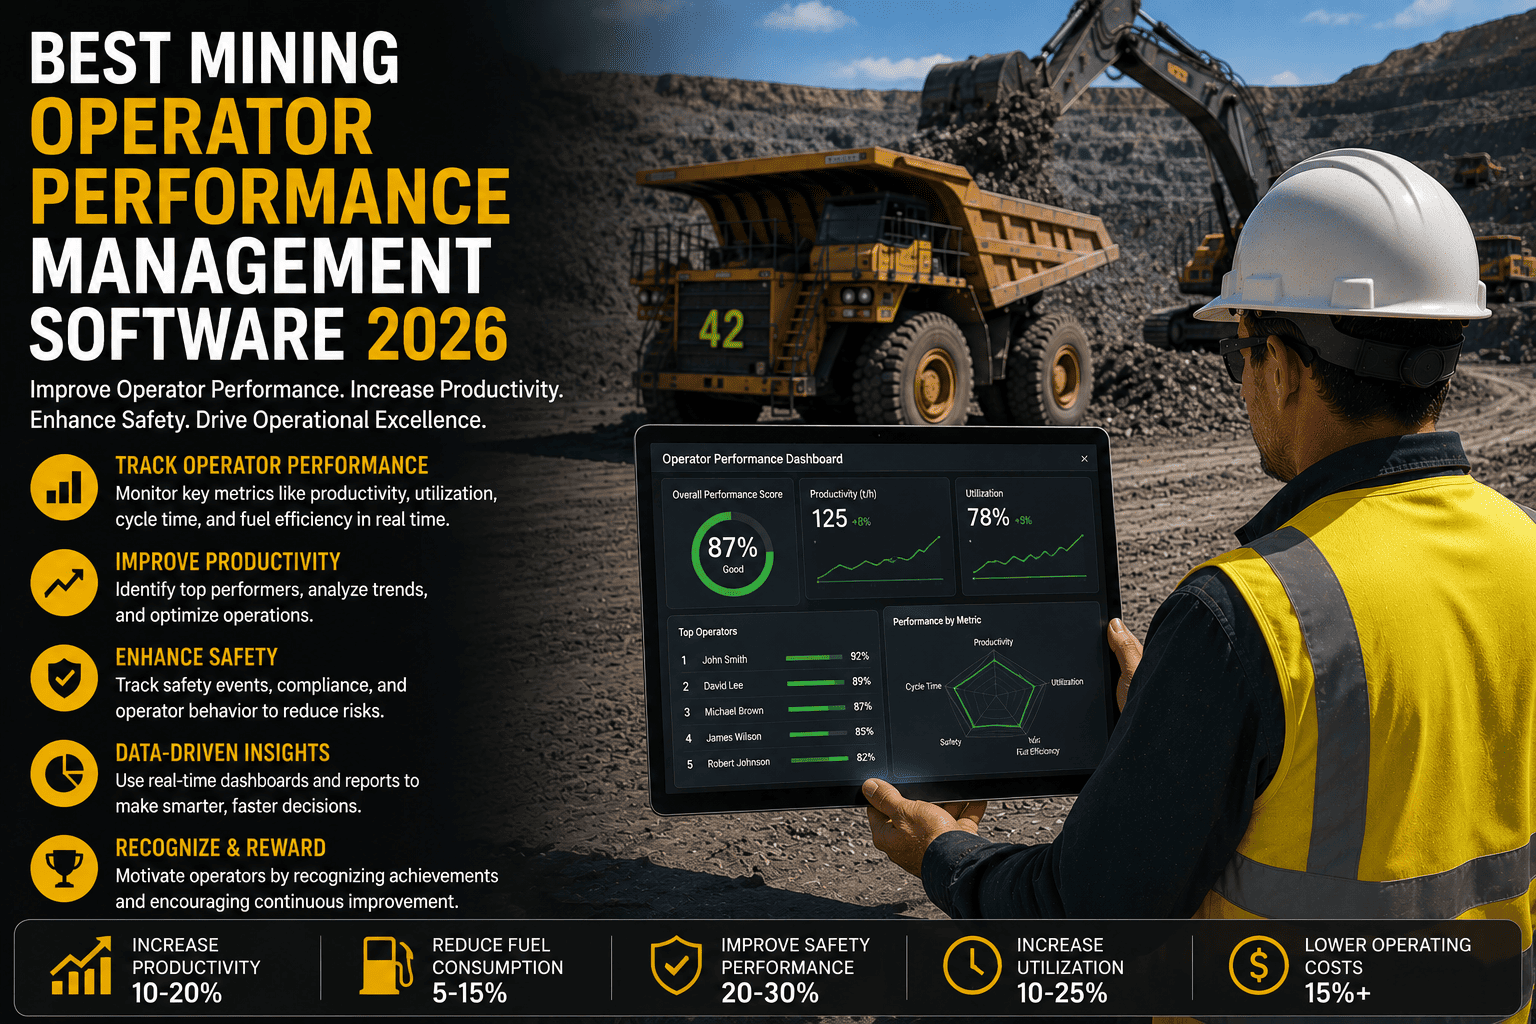
An open-pit mine can own the newest haul trucks on the market and still bleed money every shift if the people behind the controls are running blind. Two operators on the same truck, the same route, the same shift length can produce wildly different tonnage, fuel burn, and wear on the machine, and most mine sites have no reliable way to see that gap until a truck needs an unscheduled rebuild or a near-miss report lands on the safety manager's desk. Operator performance management software closes that gap by turning cycle times, payload data, braking events, and idle minutes into a live scorecard every supervisor and operator can actually see and act on.
Mining operator performance management software tracks cycle time, payload utilization, safety events, and fuel efficiency per operator, then converts that data into scorecards supervisors use for coaching. Sites that implement structured operator scorecards typically see productivity gains of 8 to 15 percent and unsafe-behavior events drop by 30 to 45 percent within the first two quarters. You can sign up for FleetRabbit to see live operator scorecards for your own fleet.
Why Operator Performance Is the Metric Mines Overlook
Mining operations spend heavily on fleet telematics, maintenance software, and dispatch systems, yet the operator behind each machine remains the least measured variable in the entire production chain. Two loader operators working the same face can differ by 15 to 20 percent in bucket fill factor. Two haul truck drivers on the same route can differ by 10 to 20 minutes of cycle time per load simply through braking habits, gear selection, and queue positioning. That gap compounds across a fleet of 30, 60, or 150 units into thousands of lost tonnes a month and accelerated wear on brakes, tires, and drivelines that shortens equipment life.
The Cost of Flying Blind on Operator Behavior
Without a system tying cycle time, payload, fuel burn, and safety events back to an individual operator ID, supervisors are left coaching on instinct and radio chatter. Underperformance goes unnoticed until it shows up as a missed production target at the end of the month, and unsafe habits go unaddressed until they cause a near-miss or a damaged tire on a haul road. Operator performance management software fixes this by pulling data directly from the machine, the fleet management system, and pre-shift inspections into one scorecard view.
What Changes Once Operators See Their Own Numbers
Performance data has a well-documented effect once it becomes visible to the person generating it: operators adjust behavior simply by knowing it is being measured. Mines that post scorecards in crew rooms and review them in shift huddles consistently report faster improvement than mines that keep the data locked inside a supervisor's spreadsheet. The software matters less for the data collection than for making that data visible, fair, and tied to a real coaching conversation.
The Core KPIs Every Operator Scorecard Should Track
A useful scorecard balances production, safety, and equipment-health metrics so operators are not rewarded for speed at the expense of safety or machine life. The table below outlines the metrics leading operations build their scorecards around.
| KPI | What It Measures | Why It Matters | Healthy Target |
|---|---|---|---|
| Cycle Time | Total load, haul, dump, and return time per loop | Directly drives tonnes moved per shift; small gains compound across every cycle | Within 5-8% of site benchmark route time |
| Payload Utilization | Actual load carried versus rated truck capacity | Under-filled loads waste fuel and cycles; over-filled loads strain components | 95-100% of rated capacity |
| Safety Score | Harsh braking, speeding, seatbelt use, zone violations | Predicts incident risk before it becomes an injury or equipment damage event | Fewer than 2 flagged events per shift |
| Fuel Efficiency | Fuel burned per tonne hauled or per operating hour | Operator throttle habits and idle time meaningfully change fuel spend fleet-wide | Within 10% of equipment class average |
| Equipment Handling | Gear shifting, brake application, dump-body cycling technique | Poor handling accelerates component wear and drives unplanned maintenance | Zero repeated abuse flags per month |
| Utilization Rate | Productive operating hours versus total scheduled hours | Reveals idle time, delays, and coordination gaps that quietly erode output | 85% or higher during scheduled hours |
FleetRabbit pulls cycle time, payload, safety events, and fuel data straight from your fleet and turns it into a live operator scorecard your supervisors can act on every shift. No spreadsheets, no manual data pulls, no waiting for end-of-month reports.
Turning Scores Into Coaching, Not Just Reports
A dashboard full of numbers changes nothing on its own. The mines that see real gains from operator performance software are the ones that build a rhythm around the data: a short shift huddle, a weekly one-on-one, a monthly trend review with the crew. The software's job is to make that rhythm fast and fair rather than to replace the human conversation.
Daily Huddles
Supervisors open the shift by flagging the one or two metrics that moved most since the last shift, giving operators a quick, specific reference point instead of a vague reminder to "be careful" or "keep pace."
Weekly One-on-Ones
A five-minute review of the week's scorecard trend lets a supervisor recognize improvement, catch a slipping habit early, and document the conversation for training records automatically.
Monthly Site Reviews
Leadership looks at fleet-wide trends by crew, shift, and equipment pairing to spot whether an entire crew needs retraining or whether one route or dig face is driving the numbers down for everyone assigned to it.
What Mines See After 90 Days of Operator Scorecards
Operations that roll out a balanced operator scorecard covering production, safety, and equipment handling consistently report the same pattern of results within the first quarter. Cycle time variance between top and bottom performers narrows as coaching closes the gap. Harsh-event flags, hard braking, speeding, seatbelt violations, drop sharply once operators know the data is visible. Fuel spend per tonne falls as throttle and idle habits improve fleet-wide, and unplanned component failures linked to equipment abuse decline as handling technique standardizes across the crew.
Calculating the ROI of Operator Performance Software
The financial case for operator performance management software is straightforward once you frame it in tonnes and dollars rather than software features. Start with your fleet's current cycle time variance between operators. If your best operator averages 10 percent faster cycles than your slowest on the same route, closing even half that gap across a 40-truck fleet translates into meaningfully more tonnes moved with the same equipment and labor cost. Add in the maintenance savings from reduced equipment abuse, since components that are shifted, braked, and loaded correctly last longer between rebuilds, and the case strengthens further. Most operations that implement structured operator scorecards recover their software investment within one to two quarters through production gains alone, before counting the safety and maintenance savings that follow.
Where the Savings Actually Show Up
Fuel savings appear first, typically within the first month, because throttle and idle habits change quickly once operators see their own fuel-per-tonne number. Safety-event reduction follows within six to eight weeks as coaching addresses the specific braking, speeding, and zone-violation patterns flagged in the data. Maintenance cost reduction takes longer to show up in the numbers, usually two to three months, but tends to be the largest cumulative saving because it compounds over the equipment's entire remaining life.
If you want to see what this looks like against your own fleet's cycle time, payload, and safety data, you can book a demo and walk through a live scorecard built from your operation's numbers.
FleetRabbit turns raw fleet and safety data into scorecards operators actually understand, so coaching conversations are specific, fair, and backed by numbers instead of guesswork. Start free with your existing fleet, no hardware overhaul required.
Frequently Asked Questions
Operator performance is the one variable in a mining operation that equipment upgrades and maintenance schedules alone cannot fix, because it lives in habits, not hardware. A well-built scorecard gives supervisors the specific, fair, day-to-day data they need to coach those habits in the right direction, and gives operators a clear picture of exactly where they stand. The mines that build this into their daily routine consistently pull more tonnes, burn less fuel, and run safer shifts with the fleet they already own. If you want to see what your own operators' cycle time, payload, and safety numbers look like on a live scorecard, you can start a free trial or book a 30-minute demo to walk through it with our team.
FleetRabbit gives every operator and supervisor a live, fair scorecard built from real cycle time, payload, safety, and fuel data. See where your fleet stands today and where coaching can take it next quarter.







