Every transit operator makes hundreds of small decisions on every shift: how hard to brake, how fast to take a turn, how closely to follow the car ahead. Most of those decisions are safe and invisible. A few are not, and without data nobody knows which drivers, routes or times of day they cluster around until a passenger falls or a collision happens. Book a demo to see how FleetRabbit turns harsh-event data into fair, practical coaching.
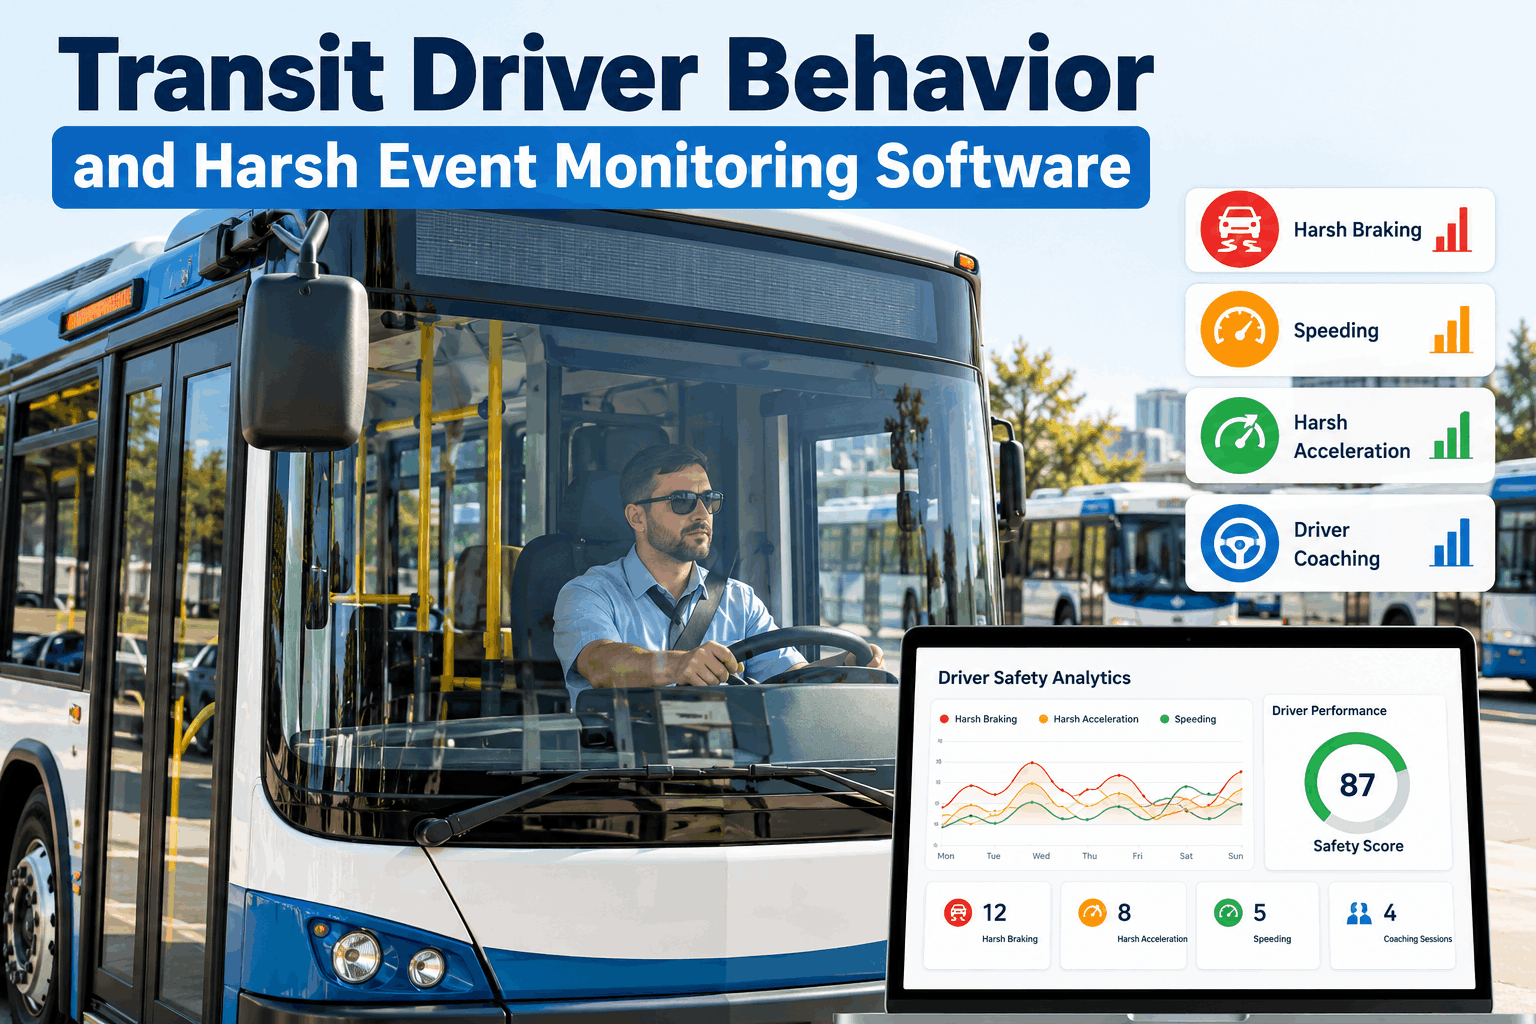
Transit Driver Behavior and Harsh Event Monitoring Software
Spot risky patterns early, coach with real trip data and recognize the operators who make every ride smoother and safer.
Five Events Worth Watching
Vehicle motion and GPS data can flag the moments that matter without anyone riding along. Start free and see which events show up in your fleet.
Why It Matters More on a Bus
A bus carries standing passengers who have nothing to brace them but a handrail. A sudden stop that a car driver would barely notice can throw a rider to the floor. Onboard falls are commonly among the most frequent passenger injuries in transit, which makes smooth driving a safety issue and a customer service issue at once.
When Events Happen
Rush hours often produce the most events. That points to route and scheduling factors, not just individual drivers.
The Coaching Loop
Data only improves safety when someone acts on it. A simple loop keeps the follow-up consistent. See the coaching workflow in a live demo.
Coach with facts instead of complaints and guesswork
Harsh-event alerts, driver safety trends and trip history in one system. Free for your first three vehicles.
Coach, Do Not Punish
Monitoring works when operators trust it. A few principles keep it fair.
Connect Behavior to the Vehicle
Driving patterns leave marks on the bus. Linking behavior data with inspection and maintenance records shows where a repair is needed and where coaching is. Book a demo to see them side by side.
Recognize the Operators Who Get It Right
A score board should celebrate safe driving as much as it flags risk. Trends matter more than a single day, so track movement over weeks. Sign up free to start building yours.
Sample data for illustration only.
What FleetRabbit Brings to Driver Safety
FleetRabbit combines vehicle location and motion data with inspection and maintenance records, so behavior is never viewed in isolation.
Frequently Asked Questions
It is the use of vehicle location and motion data to identify events such as harsh braking, harsh acceleration, hard cornering and speeding, so agencies can coach operators and reduce risk.
It works best as a coaching and recognition tool. Transparent thresholds, context and fair follow-up build trust with operators.
Standing passengers are exposed to sudden stops and sharp turns, and onboard falls are commonly among the most frequent passenger injuries.
Yes. Articulated buses, standard buses and cutaways behave differently, so thresholds should be tuned by vehicle type and reviewed for false alerts.
Yes. You can start free with three vehicles and add more as your fleet grows.
Make Every Ride Smoother and Every Operator Better Supported
Harsh-event monitoring, safety trends, trip history and audit-ready records in one system. Free for your first three vehicles.