Every transit agency collects safety information: incident reports, inspection results, complaints, maintenance records, mileage. Very few can answer simple questions with it. Are injuries going up or down per mile of service? Which routes and times of day carry the most risk? Are we on track to meet the safety targets we filed? Safety analytics turns scattered records into answers, and it gives safety teams something better than a stack of individual reports. Book a demo to see how FleetRabbit turns fleet data into a live transit safety dashboard.
Transit Safety Analytics and Dashboard Software for Agencies
See safety performance against your targets, find the patterns behind incidents and keep NTD-ready records without stitching spreadsheets together.
Why Safety Analytics Beats Safety Reports
An incident report tells you what happened once. Analytics tells you what keeps happening. Under the FTA's Public Transportation Agency Safety Plan rule, 49 CFR Part 673, agencies run a Safety Management System with a Safety Assurance component that monitors performance over time. That is an analytics job, not a filing job. Start free and put your first data on a dashboard.
Individual reports
Answer what happened in one eventLive in separate documentsReviewed after the factHard to compare across monthsSafety analytics
Shows what keeps happeningCombines every data sourceSurfaces trends before the next eventCompares performance with targetsThe Four Measures Behind PTASP Targets
PTASP requires agencies to set safety performance targets based on the measures in the National Public Transportation Safety Plan. Targets are set by mode of service and reviewed each year. Confirm the current details in 49 CFR 673.11 and the latest FTA guidance.
How Safety Rates Work
Raw counts mislead. A large agency will always have more events than a small one, and a busy quarter will always have more than a quiet one. Rates divide events by service delivered so you can compare fairly across months, modes and agencies.
Worked example with sample numbers. Use the definitions in FTA guidance for what counts as an injury, a safety event and a major mechanical failure.
Where the Data Comes From
A good dashboard is only as complete as its inputs. Most of what a safety dashboard needs already exists somewhere in your operation. The work is bringing it together. See how FleetRabbit connects these sources.
Put every safety metric on one live dashboard
Bring inspections, incidents, maintenance and mileage together with trend reporting your safety team can act on. Free for your first three vehicles.
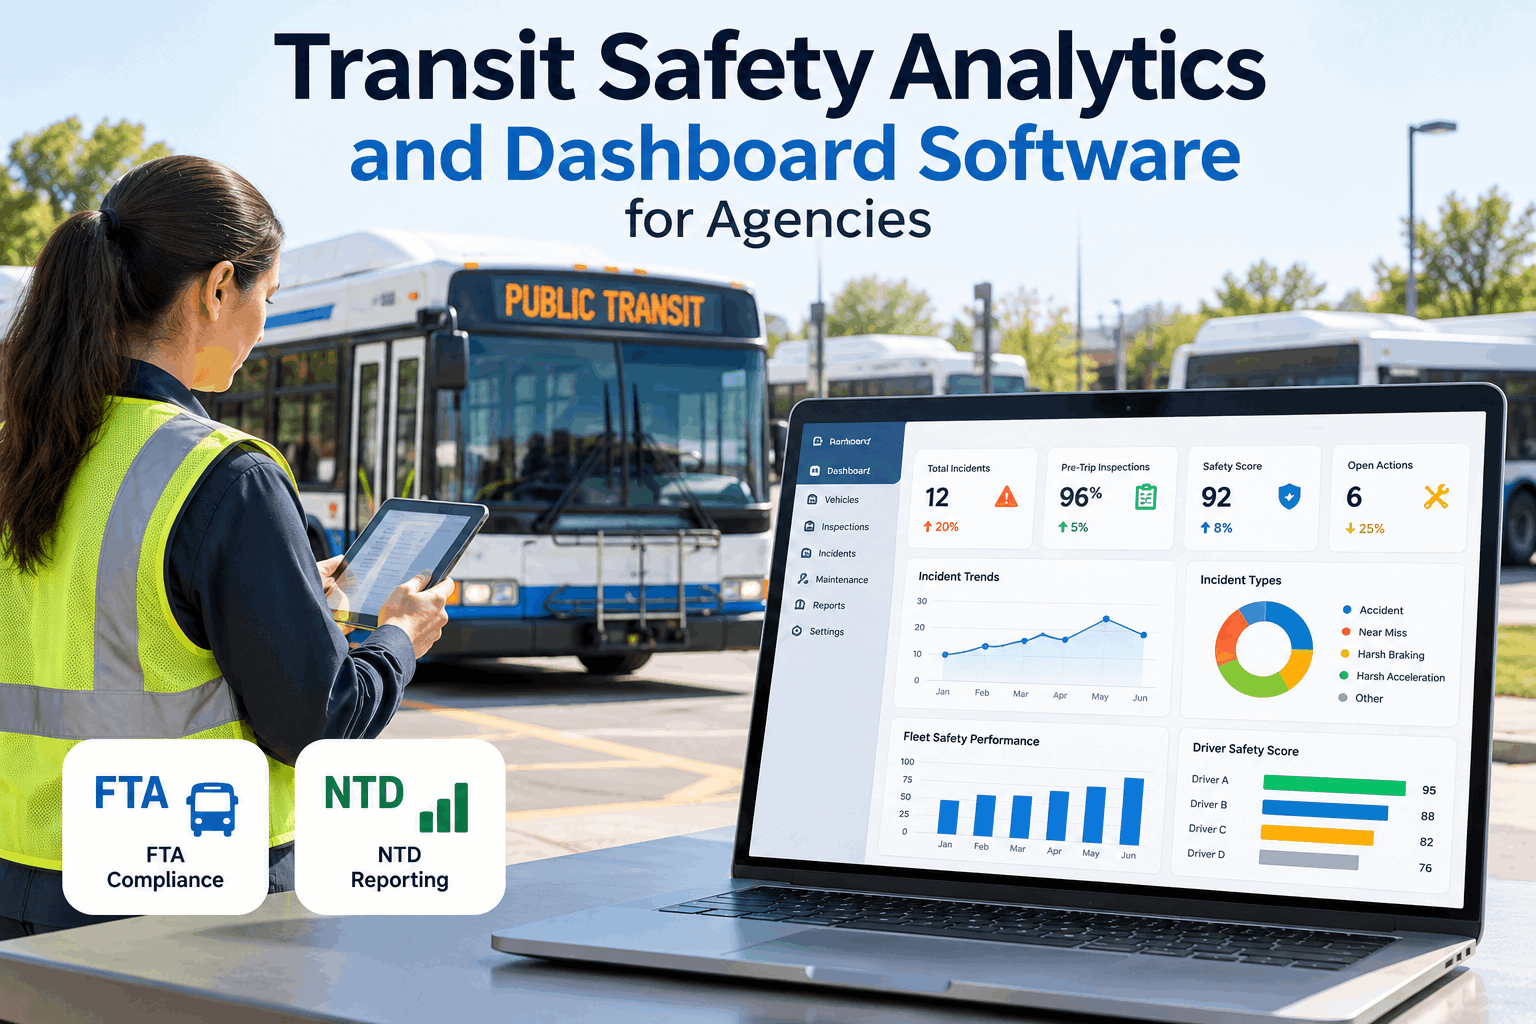
Six Dashboard Views Worth Building
Start with a small set of views that each answer a clear question, and add more as your team learns what it needs. All figures below are sample data.
Reading Trends Without Fooling Yourself
Numbers can mislead as easily as they inform. Four habits keep the analysis honest. Sign up free and track leading indicators from day one.
Leading indicators
Pre-trip failure rateOverdue PM inspectionsHarsh driving eventsNear-miss reportsLagging indicators
InjuriesCollisionsSafety eventsMajor mechanical failuresFrom Dashboard to NTD and Audit
Agencies report safety events to the National Transit Database, and reviewers ask to see how safety performance is monitored. A dashboard built on structured records shortens both conversations. Thresholds, forms and timelines are set by the FTA and differ by event and mode, so confirm current requirements in the NTD Safety and Security reporting manual. Book a demo to see NTD-ready records in action.
What FleetRabbit Brings to Transit Safety Analytics
FleetRabbit brings the vehicle, inspection, maintenance and driver data together so your safety dashboard is built on real records. It supports your safety plan and does not replace it.
Frequently Asked Questions
It is the practice of combining incident, inspection, maintenance and mileage data to measure safety performance, find patterns and support decisions.
PTASP targets are based on fatalities, injuries, safety events and system reliability, and are set by mode of service. Confirm current requirements with the FTA.
Rates let you compare months, modes and agencies fairly by accounting for how much service was delivered.
Lagging indicators such as injuries show what already happened. Leading indicators such as failed inspections and overdue PM point to risk before harm occurs.
Structured incident and vehicle records make it easier to classify events, gather details and answer reviewers quickly. The official submission still follows FTA rules.
Yes. You can start free with three vehicles and add more as your fleet grows.
Turn Safety Data Into Decisions Your Team Can Act On
Dashboards, trend reporting, real-time alerts and audit-ready records in one system. Free for your first three vehicles.