Two buses can roll off the same production line, run the same total mileage in a year, and need completely different brake service schedules, because the route each one runs matters more than the odometer does. A bus working a dense urban local route with a stop every few blocks is cycling its brakes constantly, while a bus on an express or limited-stop route covers similar distance with a fraction of the stop-and-start wear. Fleets that schedule brake service purely on a mileage interval end up over-servicing express buses and, more dangerously, under-servicing the local routes that are actually chewing through pad life. FleetRabbit ties brake wear tracking to route assignment and real braking behavior instead of treating every mile the same. You can sign up to see how your own route assignments line up with actual brake wear rates.
Brake Wear by Route Type
The physics is straightforward. Every stop means a braking event, and a route with more stops per mile puts proportionally more cycles on the brake system regardless of total distance covered. You can sign up to see this comparison built from your own agency's route data.
Express Route
Long stretches between stops keep braking events infrequent relative to distance covered.
Local Stop-and-Go Route
Frequent stops every few blocks put far more braking cycles on the system per mile driven.
BRT Limited-Stop Route
Fewer stops than a local route but more than an express route, landing wear in between.
What a Brake-Related Road Call Actually Triggers
A road call rarely stays contained to the one bus that broke down. It sets off a chain of consequences that shows up in performance numbers well beyond the maintenance shop. Fleets that sign up can trace this chain back to the specific route and vehicle that started it.
A bus develops a brake issue severe enough to require pulling out of service mid-route.
Passengers on board experience a service disruption and a delayed or cancelled trip.
A replacement bus has to be dispatched, pulling capacity from somewhere else in the system.
On-time performance takes a hit for that route, and the agency's Mean Distance Between Failures figure drops.
A lower MDBF figure draws attention in board reporting and State of Good Repair reviews.
Stop Losing Buses to Preventable Brake Failures
Track brake wear by route and braking behavior, not just mileage, and catch developing issues before they become road calls.
Harsh Braking Compounds Route-Based Wear
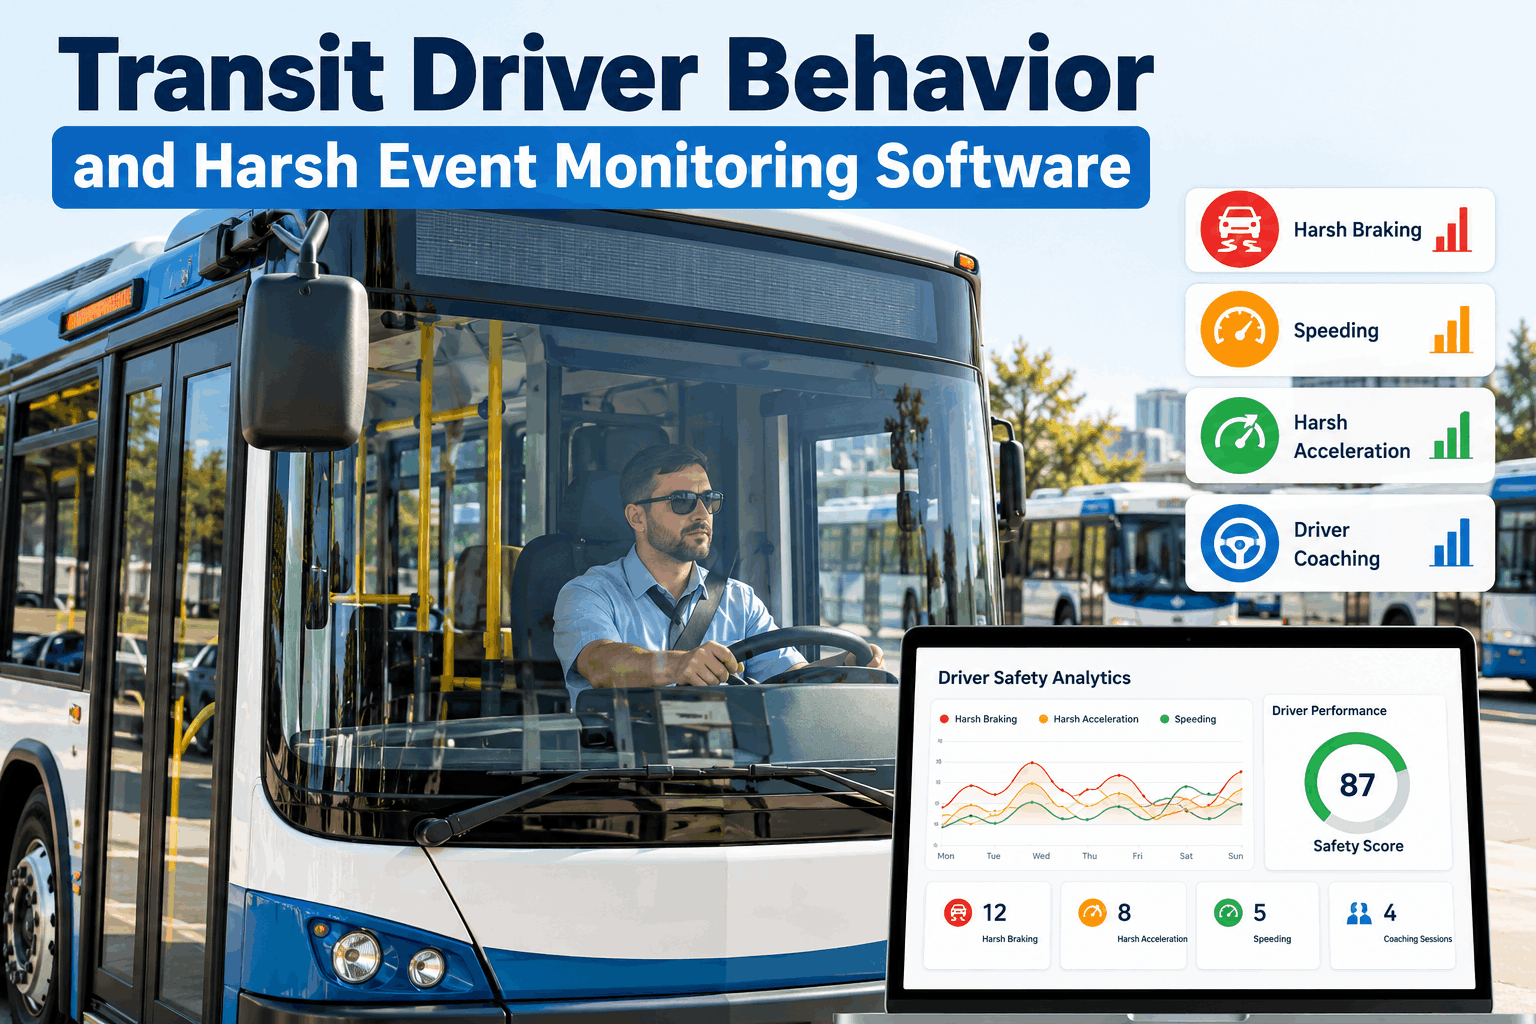
Route type sets the baseline, but how an operator brakes on top of that baseline changes wear rates further. A route full of hard, late braking events wears pads faster than the same route driven with smooth, early braking, even though both buses covered the same stops.
Hard, late braking events accelerate pad and rotor wear beyond what the route alone would predict, shortening service intervals.
Gradual, anticipated braking spreads wear more evenly and can meaningfully extend brake life on the same route.
Fleets that sign up for FleetRabbit can identify which routes and which braking patterns are driving wear rates up, rather than only reacting once a bus is already due for service.
Core Brake Monitoring Features
Each feature below is built around the fact that route and behavior matter as much as mileage. You can book a demo to see all four working together across your own fleet.
Route-Adjusted Service Intervals
Brake service schedules factor in the stop density of a bus's assigned route rather than treating every mile the same.
Harsh Braking Event Tracking
Harsh braking events are logged by route and by operator, surfacing patterns that predict accelerated wear.
Predictive Wear Alerts
Vehicles trending toward early brake service based on actual wear indicators are flagged before a road call happens.
MDBF and Road Call Reporting
Mechanical failure data feeds directly into Mean Distance Between Failures reporting used in State of Good Repair reviews.
Illustrative Brake Service Intervals by Route Type
| Route Type | Relative Brake Service Frequency |
|---|---|
| Express Route | Longest interval, wear closest to a mileage-based baseline |
| BRT Limited-Stop Route | Moderate interval, shorter than express but longer than local |
| Local Stop-and-Go Route | Shortest interval, requiring the most frequent brake attention |
You can book a demo to see this pattern modeled against your own agency's actual route assignments.
Mileage-Based Scheduling vs. FleetRabbit
| Task | Mileage-Based Scheduling | FleetRabbit |
|---|---|---|
| Setting brake service intervals | Same interval regardless of route assigned | Adjusted based on route stop density and wear data |
| Tracking harsh braking behavior | Not typically monitored | Logged by route and operator automatically |
| Catching a developing brake issue | Usually found at the next scheduled service or a road call | Flagged by predictive wear alerts before failure |
| Reporting on mechanical failures | Compiled manually for MDBF reporting | Calculated automatically from logged road call data |
Match Brake Service to Real Wear, Not Just Mileage
Route-adjusted intervals, harsh braking tracking, and predictive alerts to keep buses out of the road call statistics.
Frequently Asked Questions
Why do buses on the same total mileage need different brake service schedules
Brake wear is driven more by the number of braking events than by total distance traveled, so a bus running a dense stop-and-go local route wears its brakes faster than a bus covering similar mileage on an express route with far fewer stops.
What is Mean Distance Between Failures and why does it matter for brakes
Mean Distance Between Failures, commonly called MDBF, is a standard transit metric calculated by dividing total revenue miles by the number of mechanical failures. Brake-related road calls are a common contributor to mechanical failures, so reducing them tends to improve this figure directly.
Does operator driving behavior actually affect brake wear
Yes. Frequent hard, late braking accelerates pad and rotor wear beyond what the route alone would predict, while smoother, earlier braking on the same route can meaningfully extend brake life.
How does brake wear connect to State of Good Repair reporting
State of Good Repair reviews consider overall vehicle condition relative to useful life benchmarks, and mechanical reliability data such as road call frequency and MDBF feeds into how that condition is assessed and reported.
Can FleetRabbit predict a brake failure before it causes a road call
FleetRabbit tracks route-adjusted wear indicators and harsh braking patterns to flag vehicles trending toward early brake service, giving maintenance a chance to intervene before the issue turns into an in-service failure.