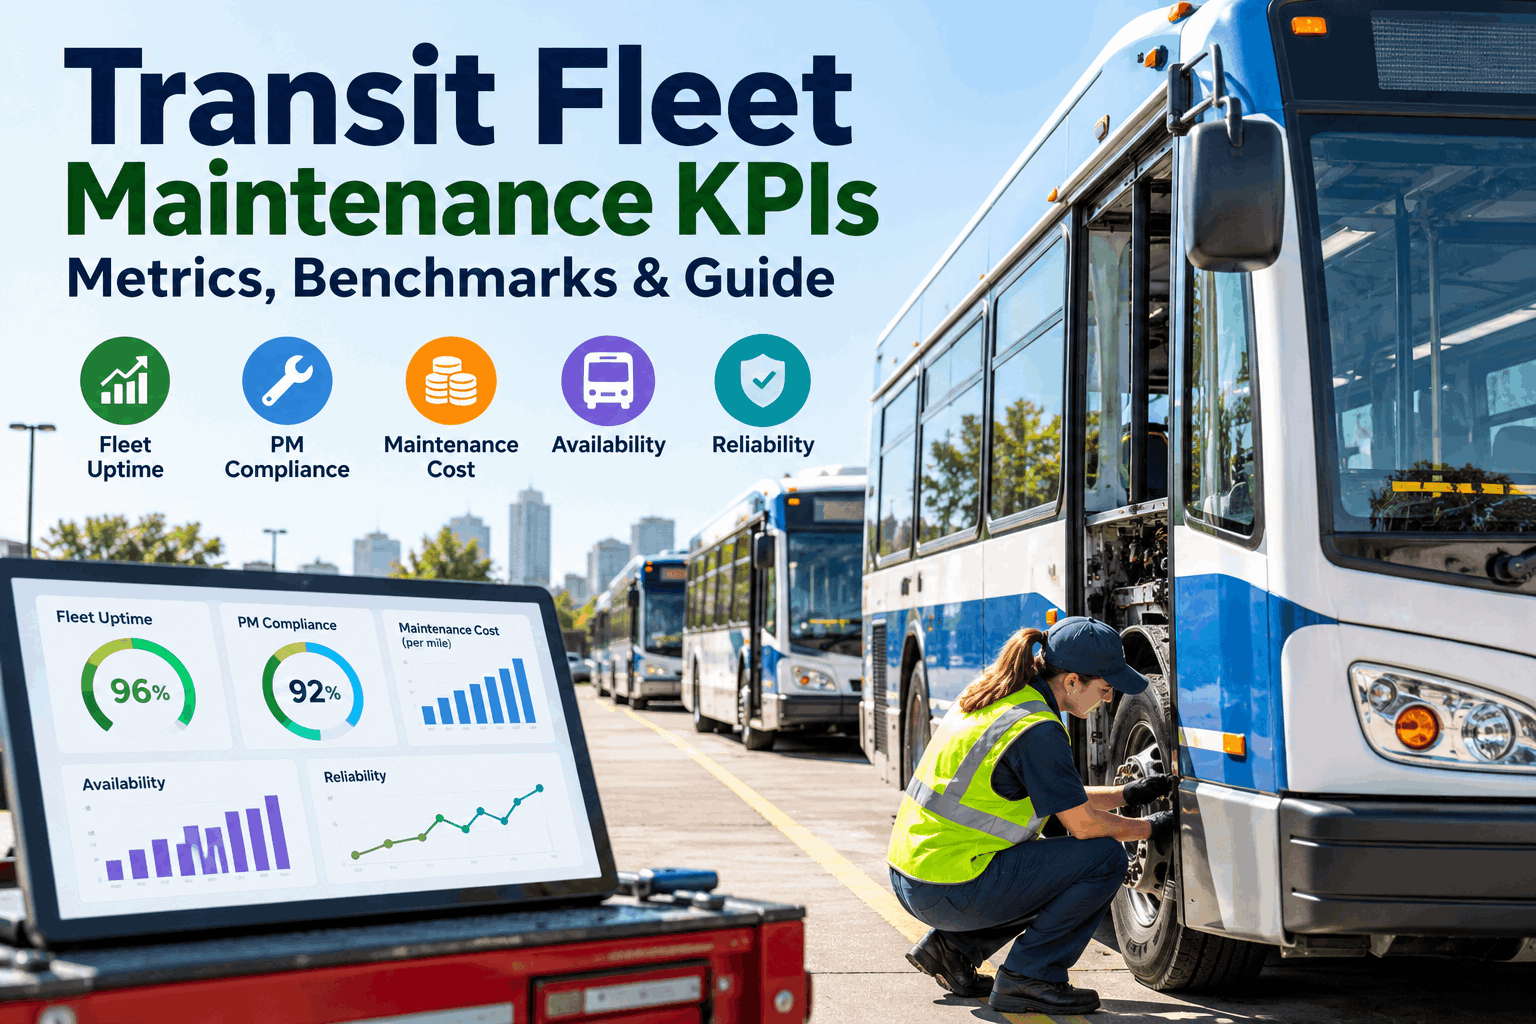
A bus that pulls out on time and a bus that fails on Route 12 can look identical on a morning report. The difference shows up in the numbers behind the shop door: how many PMs finished on time, how many miles buses run between breakdowns and how much each mile costs to keep on the road. Transit agencies that track a small set of maintenance KPIs catch problems weeks before riders do. See how FleetRabbit turns fleet records into KPI-ready data and stop reporting from memory and spreadsheets.
Transit Fleet Maintenance KPIs Explained, With Benchmarks You Can Use
Six numbers tell you whether your buses are ready, your PM program is working and your budget is under control. Here is what each one means and where a healthy fleet tends to land.
Leading Numbers Predict, Lagging Numbers Confirm
Some KPIs warn you early. Others tell you what already happened. You need both, because a strong lagging number today usually traces back to a leading habit from last month.
The Six-KPI Scoreboard
Start with these. Each row shows the formula, a commonly cited benchmark and the warning sign to act on.
Fleet availability
Vehicles ready for service ÷ total fleet
PM compliance
PMs finished on time ÷ PMs due. Count a PM as on time only inside a set window, such as 10% of the interval.
Mean distance between failures
Revenue miles ÷ major mechanical failures. This is the reliability measure the NTD and your safety plan use.
Road calls per 10,000 miles
Road calls ÷ miles × 10,000. Includes every in-service breakdown, minor or major.
Maintenance cost per mile
Total maintenance cost ÷ miles driven. Split by bus type so old and new buses are not blended.
Planned work share
Scheduled work orders ÷ all work orders.
Benchmarks are commonly cited industry ranges and the FTA safety guide's sample bus target. They differ by fleet, so set your own targets from your baseline.
Read the Zones, Not Just the Number
A single percentage hides how close you are to trouble. Use zones so the whole team knows when to watch and when to act.
Zones are illustrative and not drawn to scale.
Where these KPIs meet the FTA
Note that the NTD counts only major mechanical failures. Your internal road call count will be higher, so track both.
Why PM Compliance Moves Your On-Time Performance
A bus that breaks down mid-route delays every trip behind it. One industry analysis reports that agencies with higher PM compliance tend to post better on-time performance.
Bars show reported on-time performance ranges. This is a pattern, not a guarantee, and results vary by route and traffic.
Turn Every Work Order Into a KPI You Can Trust
Track PM, repairs, inspections, hours and downtime for each bus in one place. Free for your first three vehicles.
Every KPI Needs Clean Data Behind It
A KPI is only as good as the records feeding it. Start free and capture these from day one.
Your First 30 Days With KPIs
Frequently Asked Questions
Start with fleet availability, PM compliance, mean distance between failures, road calls, maintenance cost per mile and planned work share. Together they cover readiness, prevention, reliability and cost.
Many programs aim for 90% or higher, and below 80% is a common warning sign. Define what counts as on time first, or the number will overstate your performance.
It uses vehicle revenue miles between major mechanical failures, reported by full reporters on the maintenance performance form. A major failure stops the vehicle from completing or starting a scheduled trip.
Many agencies target 95% or higher. Falling below 90% usually points to parts, staffing or PM problems worth fixing quickly.
Availability daily, PM compliance and work orders weekly, and cost and replacement trends monthly or quarterly.
Yes. You can start free with three vehicles and add more as your fleet grows.
Give Your Shop the Numbers to Prove Its Performance
PM history, inspections, work orders, downtime and live tracking for every transit vehicle in one system. Free for your first three vehicles.