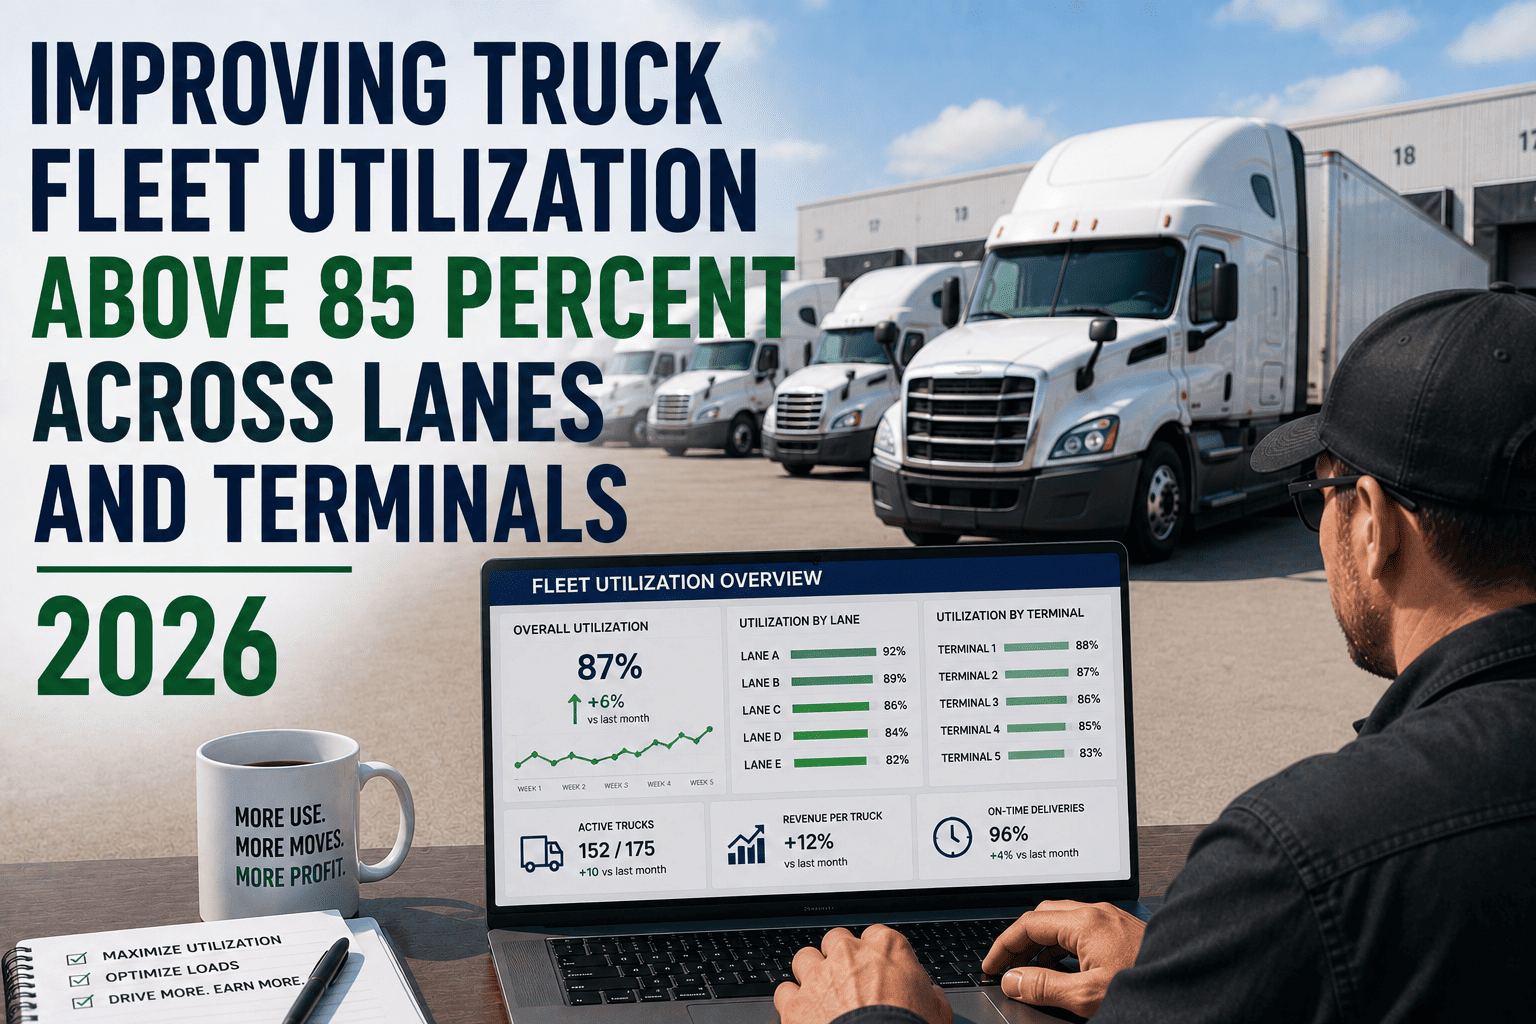
Improving truck fleet utilization above 85% is a key goal for trucking companies seeking higher productivity and profitability in 2026. By leveraging smarter dispatching, real-time asset tracking, route optimization, and idle reduction strategies, fleets can maximize vehicle usage across lanes and terminals. Modern fleet analytics platforms provide visibility into asset performance and utilization trends, helping managers identify inefficiencies and optimize operations. Higher fleet utilization leads to better resource allocation, reduced operational costs, and increased revenue generation.
Fleet Utilization & Asset Optimization
Improving Truck Fleet Utilization Above 85% Across Lanes and Terminals
Most fleets aren't short on trucks. They're short on visibility into which trucks are actually earning their keep, at which terminal, on which lane. Closing that gap is how fleets reach 85% utilization without buying a single new vehicle.
That 24-point gap between an average fleet and a top performer is not a fleet-size problem. It's a visibility problem. The same number of trucks, parked at the same terminals, running the same lanes, can produce wildly different utilization depending on whether dispatch can see which asset is sitting idle right now. This guide breaks down what 85% actually requires, where utilization typically leaks out by lane and terminal, and the specific levers that move the number without adding a single vehicle to your fleet.
What 85% Utilization Actually Means
Fleet utilization rate is calculated as revenue-producing hours divided by available hours, tracked per truck and per trailer rather than as one fleet-wide blend. Industry productivity benchmarks for 2026 point to 85% or better as the mark of a top-performing mixed fleet, alongside strong cost per mile and maintenance compliance. The problem is that a fleet-wide average of 85% can still hide individual units running at 40% or below, quietly consuming fixed costs while contributing almost nothing to revenue.
What good utilization looks like by asset class
- Heavy articulated tractors: 78 to 88 percent
- Rigid/straight trucks: 72 to 82 percent
- Light commercial vans: 65 to 78 percent
- Dry van trailers: fleet average around 74 percent
What signals a real problem
- Any unit below 60 percent for 30+ days
- Availability for dispatch below 88 percent
- Empty miles above 20 percent of total miles
- Wide variance between best and worst unit in the same class
Where Utilization Actually Leaks Out
Dispatch lag
The gap between a job being ready and an asset being assigned. A pre-trip inspection delay alone can cut daily availability by roughly 18 minutes per unit, and manual dispatch boards routinely lose hours hunting for the next available truck.
Ghost assets at terminals
Equipment that's technically available but sits in status limbo, returned but not yet marked ready, waiting on a part with no ETA, or simply lost in a yard with no real-time location data.
Empty miles by lane
A 2025 industry study found 58 percent of truckloads moved with unused trailer space. Lanes with chronic backhaul gaps quietly drag down utilization even when the truck is technically "moving."
Wrong asset, wrong job
Sending a heavy tractor on a light load, or vice versa, forces an oversized asset into underutilized work it wasn't suited for, while the right-sized unit sits at the terminal instead.
Unplanned downtime
Breakdowns that weren't caught early pull a unit out of rotation at the worst possible time, and the lost hours rarely get backfilled by the rest of the fleet.
See your own leak points
FleetRabbit ranks every truck and trailer by utilization, lane, and terminal automatically.
Book a DemoUtilization by Lane: Why the Same Fleet Performs Differently
Utilization rarely fails uniformly across a fleet. It fails by lane. A regional lane with reliable backhaul freight can run a unit at 85 percent or better. A seasonal or one-directional lane on the same fleet might run the same truck class at 50 percent, simply because there's nothing to haul on the return leg.
| Lane Type | Typical Utilization | Primary Constraint |
|---|---|---|
| High-density regional lane | 80 to 90 percent | Reliable backhaul freight in both directions |
| Long-haul OTR lane | 70 to 80 percent | Hours-of-service limits and driver availability |
| Seasonal or one-directional lane | 45 to 60 percent | Empty return legs with no consistent backhaul |
| New or unproven lane | Below 50 percent | Limited freight visibility and load matching data |
A fleet-wide utilization average hides this entirely. Two fleets with identical 70 percent averages can have completely different problems, one with consistent moderate underuse, the other with a few excellent lanes masking several lanes that barely work at all.
Find Out Where Your Fleet Actually Stands
FleetRabbit calculates utilization per truck and trailer automatically from GPS and dispatch data, then ranks every unit by lane and terminal so underperformers stop hiding inside a healthy fleet average. Sign up for FleetRabbit and get your first utilization report this week.
Terminal Readiness: The Overlooked Half of Utilization
Lane performance gets most of the attention, but terminal handling is just as often the bottleneck. A truck can be perfectly matched to a profitable lane and still post poor utilization if it spends too long at the terminal between loads.
Track time from "job ready" to "asset assigned"
This single handoff delay is one of the most common and most fixable sources of lost utilization at any terminal. Map it before assuming the problem is demand.
Give every terminal real-time asset status
A unit sitting in "returned but not inspected" status for half a day is invisible to dispatch even though it's technically on the lot. Real-time status removes that blind spot.
Match asset class to job size automatically
Automated dispatch logic that matches by location, readiness, and load size prevents oversized trucks getting sent on light jobs while the right-sized unit waits.
Review utilization by terminal monthly, not annually
Terminal-level patterns shift with seasonal freight and staffing changes. A monthly review catches a declining terminal before it drags down the fleet-wide number for a full quarter.
Most of this is achievable without new hardware, since the data already exists in dispatch records and GPS feeds. The challenge is usually that it lives in three disconnected systems instead of one. Book a demo to see how FleetRabbit pulls dispatch, GPS, and maintenance data into a single terminal-level utilization view.
The Cost of Staying Below 85%
Lost per day, per idle truck, in fixed ownership costs alone, insurance, depreciation, and financing that accrue whether the wheels turn or not.
Excess vehicles many fleets are carrying that a clear utilization picture would reveal as candidates for redeployment or disposal.
Typical cost-per-mile reduction available simply by improving asset utilization, no new equipment required.
Five Steps to Push Past 85%
Start with visibility
- Calculate utilization per truck and trailer, not fleet-wide
- Rank every unit by lane and by terminal
- Flag anything under 60 percent for 30-day review
Then act on the data
- Redeploy underused assets to high-demand lanes
- Right-size fleet before buying new vehicles
- Automate dispatch matching by readiness and load fit
Fleets that improve utilization by just 10 to 20 percent typically see that gain reflected directly in monthly profitability, without changing fleet size or freight volume. The lever is almost always visibility first, action second. A free sign up for FleetRabbit gives you the per-asset visibility layer immediately, so the action step has real data behind it from day one.
Frequently Asked Questions
The Bottom Line on Fleet Utilization
Reaching 85 percent utilization rarely comes from buying more trucks or chasing more freight. It comes from seeing clearly which assets are already earning their cost and which ones are quietly sitting at a terminal, mismatched to a lane, or lost in dispatch lag. Once that picture exists by truck, by trailer, by lane, and by terminal, the path to 85 percent usually involves redeploying what you already own rather than expanding the fleet at all.
See Exactly Where Your Fleet's Utilization Stands
FleetRabbit tracks utilization by truck, trailer, lane, and terminal automatically, turning a hidden fleet-wide average into a clear, actionable ranking. Find your underperformers before they cost you another quarter.







