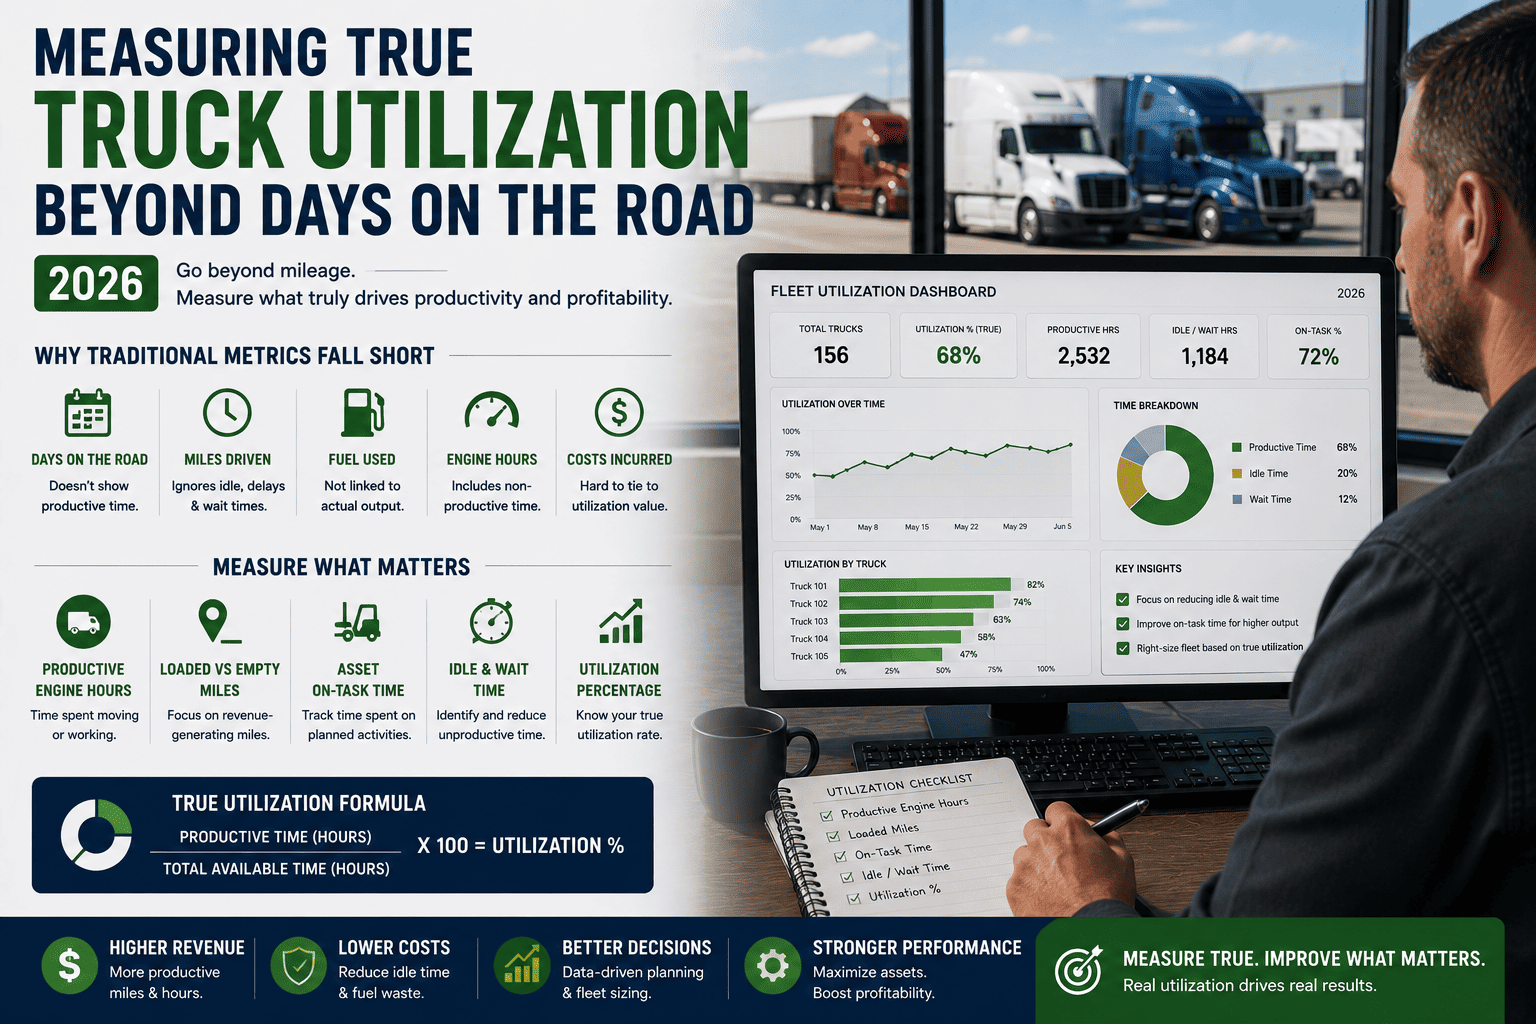
A truck that leaves the yard every single day still looks "busy" on paper, yet plenty of fleets running near 100% dispatch rates are quietly bleeding margin. Days on the road is the easiest number to pull, and it is also the most misleading one. True truck utilization lives in the hours between departure and arrival: how many of those miles were loaded, how much of the shift was productive versus idle, and whether the trailer was full or half empty. Fleet managers who only track "did the truck go out today" are flying blind on the metric that actually determines profitability.
Best-in-class long-haul fleets run at 70 to 80 percent time utilization, while mixed fleets often average only 45 to 60 percent despite paying full fixed costs on every unit. Nearly 58 percent of truckloads move with empty trailer space, and long-haul trucks idle roughly 6 hours a day on average. A truck simply leaving the gate tells you almost nothing about whether it is earning its keep.
Why "Days on the Road" Hides the Real Story
Dispatch reports are built around a simple checkbox: did the truck run today or not. That checkbox feels reassuring, but it treats a truck that drove 500 loaded miles the same as a truck that drove 80 miles with a half-empty trailer and sat at a loading dock for six hours. Both show up as "utilized" in a basic report, yet one is generating strong revenue per mile and the other is quietly losing money.
Fewer than 30 percent of mid-size trucking fleets actively monitor utilization by individual asset, which means most fleet managers can tell you total miles driven and total fuel spent, but not which specific trucks are dragging down the average. That blind spot lets underperforming units stay in the fleet month after month, consuming insurance, depreciation, and financing costs whether the wheels turn or not.
The Three Layers Hiding Underneath a Single Utilization Number
A fleet-wide utilization percentage is really a blend of three separate signals, and treating them as one number is where most reporting goes wrong.
The Metrics That Replace "Did It Leave the Yard"
Measuring true utilization means separating productive activity from everything that only looks like activity. The table below breaks down the metrics that matter, what healthy ranges look like in 2026, and what typically causes a number to fall short.
| Utilization Metric | What It Measures | Healthy 2026 Benchmark | Common Cause When Low |
|---|---|---|---|
| Time Utilization | Revenue-producing hours divided by total available hours per truck | 70 to 80 percent for long-haul, 45 to 60 percent typical for mixed fleets | Poor dispatch handoff and manual job assignment delays |
| Idle Percentage | Engine-on hours with no movement divided by total engine-on hours | Below 15 percent of engine-on time | Extended dock waits, driver breaks miscoded as active, poor route sequencing |
| Loaded Mile Ratio | Loaded miles divided by total miles driven, including deadhead | Above 85 percent for dedicated lanes | Empty repositioning legs and one-way freight imbalances |
| Trailer Fill Rate | Used trailer capacity divided by total available capacity | Above 80 percent average load fill | Under-consolidated freight and rushed load planning |
| Mechanical Availability | Time the truck is physically ready to work versus scheduled time | Above 94 percent fleet-wide | Reactive maintenance and unresolved recurring defects |
| Revenue Miles Per Day | Average paid miles completed per truck per operating day | Varies by lane, tracked against fleet average per asset | Undersized routing, driver hours mismanagement, dispatch delays |
FleetRabbit pulls GPS, telematics, and dispatch data into one live view so you can see time utilization, idle percentage, loaded miles, and trailer fill for every truck individually, not blended into a single fleet-wide number. You can sign up free and see your own numbers today.
How Underutilization Quietly Erodes Fleet Profit
Every idle truck still carries its full fixed cost load. Depreciation, insurance, financing, and registration accrue whether the vehicle moves a single mile that day or not. Industry data shows the average fleet carries 15 to 20 percent of its vehicles underutilized at any given time, and each of those units can cost 8000 to 15000 dollars annually in carrying costs while contributing almost nothing to revenue. On a 100-truck fleet, that arithmetic alone can quietly drain hundreds of thousands of dollars a year.
The gap compounds further once idle time and empty miles combine. A truck idling 8 hours a day for 300 days a year wastes roughly 6000 dollars in fuel for zero productive output. Scale that across a 100-truck fleet and just two extra hours of daily idling can push total waste past 1.5 million dollars annually. None of this shows up in a report that only asks whether the truck went out on the road.
Why "Higher Is Always Better" Is a Myth
It is tempting to chase utilization as high as possible, but pushing every truck toward 95 percent or above removes the buffer needed for preventive maintenance windows, which usually leads to more unplanned breakdowns and cascading delivery delays later. The healthiest fleets treat utilization as a balance point rather than a maximum to chase, protecting room for scheduled service while still keeping trucks earning.
A Quick Way to Spot the Balance Point
Compare your busiest day's demand against your average daily demand. A ratio above 1.3 usually means the fleet is sized for peaks that only happen 10 to 15 percent of the time, leaving 20 to 30 percent of vehicles sitting idle the rest of the year. That single ratio often explains more about a low utilization number than any single truck's driving habits do.
Building a Utilization Dashboard That Tells the Truth
Getting past the days-on-the-road illusion starts with pulling 90 days of telematics data for every truck: ignition on and off events, loaded and unloaded miles, and engine hours. Calculate time utilization per truck individually and rank the fleet from lowest to highest instead of relying on a single blended average. This step alone typically reveals that a meaningful share of the fleet is running well below 50 percent utilization, hiding behind a healthy-looking fleet average.
From there, categorize the lowest performers into three groups: redeploy the truck to a lane or terminal with stronger demand, move it into a shared pool instead of a dedicated assignment, or defleet it entirely if the data consistently shows it cannot earn its keep. Fleets that go through this exercise routinely find units that were never truly needed, freeing up capital that was otherwise locked into idle steel.
Turning Data Into a Weekly Habit
A one-time utilization audit is useful, but the fleets that sustain improvement build it into a weekly routine. Reviewing per-truck utilization, idle percentage, and loaded mile ratio every week, rather than once a quarter, catches a declining truck while there is still time to reroute, repair, or reassign it instead of discovering the problem in an annual report months later.
FleetRabbit's dashboard updates utilization rates, idle cost totals, loaded mile ratios, and mechanical availability automatically, so your team reviews real numbers every week instead of compiling spreadsheets. Fleet managers using data-driven utilization tracking consistently outperform those relying on gut feel. You can book a demo to see your own fleet's dashboard in action.
Frequently Asked Questions
Key Takeaways
Days on the road was never a reliable measure of fleet performance, it was simply the easiest number to pull from a dispatch log. True truck utilization requires looking underneath that surface number at time, distance, and capacity together, per truck rather than blended into a single fleet-wide average. Fleets that make this shift consistently uncover idle capital, underused trailers, and dispatch delays that were invisible before, and they recover that value without buying a single new vehicle.
FleetRabbit gives you per-truck visibility into time utilization, idle percentage, loaded miles, and trailer fill, so you can see exactly which assets are earning their keep and which ones are quietly costing you money. Start your free trial today with no credit card required, or book a demo to see your own fleet's numbers.







