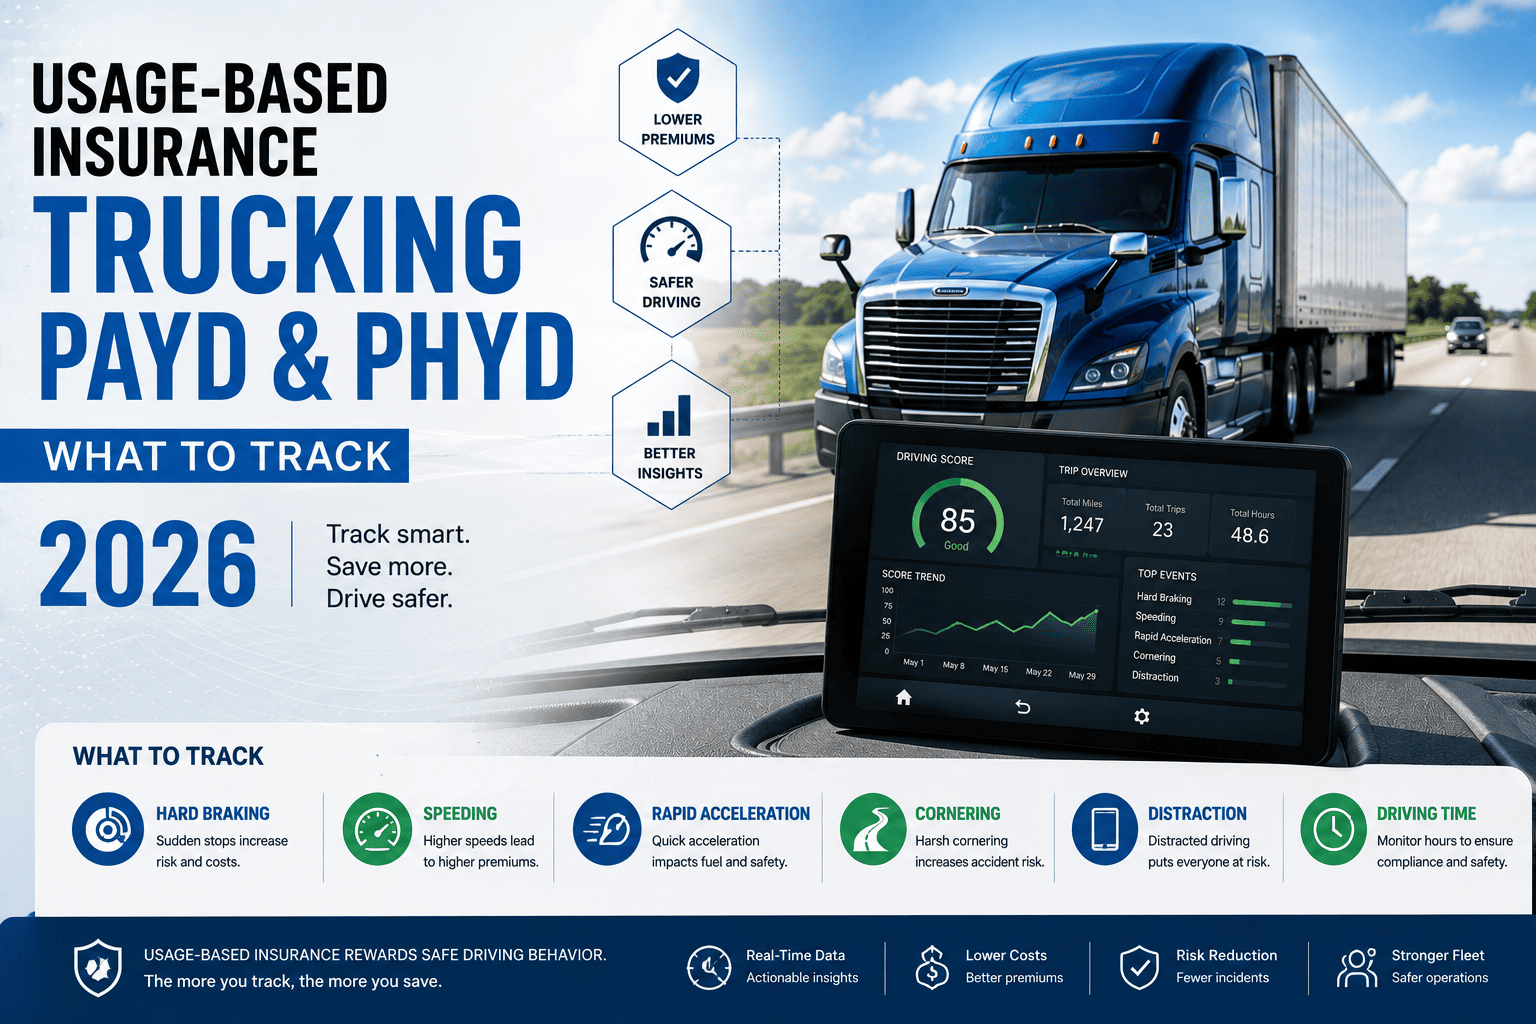
Usage-based insurance (UBI) is transforming the trucking industry by using telematics data to calculate insurance premiums based on actual fleet usage and driver behavior. In 2026, models such as Pay-As-You-Drive (PAYD) and Pay-How-You-Drive (PHYD) help fleets lower insurance costs through mileage tracking, driving patterns, and risk analysis. Modern UBI solutions monitor key metrics including distance traveled, speeding, harsh braking, idling, and driver safety scores. By leveraging real-time telematics and analytics, trucking companies can improve safety performance, reduce risk exposure, and achieve significant savings on commercial fleet insurance premiums.
Stop Overpaying on Trucking Insurance.
Your Data Should Work for You.
PAYD. PHYD. Telematics. Three tools that reward safe fleets with lower premiums — and most trucking companies aren't using any of them.
Traditional trucking insurance prices your fleet based on what you might do — your vehicle type, your location, your history. Usage-Based Insurance (UBI) prices your fleet based on what you actually do. In 2026, that difference is worth tens of thousands of dollars annually for fleets that get it right.
This guide breaks down exactly how PAYD and PHYD work, what metrics insurers track, and how FleetRabbit helps you capture the data that lowers your premiums — automatically.
What Is Usage-Based Insurance for Trucking?
Usage-Based Insurance (UBI) is a model where your commercial fleet premiums are calculated using real, live data from your vehicles — not statistical averages. Instead of a static rate set annually, UBI programs continuously assess your fleet's actual risk profile using telematics, GPS, and onboard diagnostics.
For trucking fleets, this is a massive shift. A fleet that logs fewer miles, drives safer routes, and demonstrates responsible driver behavior can pay dramatically less than a similar-sized fleet with identical vehicle types. UBI levels the playing field and rewards operational discipline.
The Three UBI Models at a Glance
PAYD
Premiums tied directly to mileage. The less you drive, the less you pay. Ideal for seasonal or regional fleets with variable annual mileage.
PHYD
Premiums tied to driving behavior — braking, acceleration, speed, cornering. Safe drivers earn lower rates. The largest UBI segment at 38.9% market share.
MHYD
Combines mileage and behavior data with active fleet management tools. Insurers provide coaching programs. Rewards fleets that invest in safety systems.
PAYD vs PHYD: Which One Saves Your Fleet More?
Choosing between PAYD and PHYD isn't a one-size-fits-all decision. It depends on your fleet's operational profile, driver behaviors, and how your routes are structured. Book a demo with FleetRabbit to see which model fits your specific numbers.
| Factor | PAYD | PHYD |
|---|---|---|
| Premium Basis | Miles driven | Driving behavior score |
| Key Metric | Odometer / GPS mileage | Braking, speed, cornering, acceleration |
| Best For | Fleets with variable or low mileage | Fleets with consistent routes, safe drivers |
| Savings Potential | 10–25% vs traditional pricing | 15–30% vs traditional pricing |
| Data Required | GPS tracking, odometer readings | Full telematics: OBD-II or embedded |
| Risk for Fleet | Higher mileage = higher cost | Poor driver scores = higher cost |
| FleetRabbit Support | ✓ Automated mileage capture | ✓ Real-time behavior scoring |
The 6 Metrics Insurers Track — And How to Score High
Your UBI premium isn't a black box. Insurers use a defined set of behavioral signals to score your fleet's risk. Knowing exactly what they measure — and optimizing for it — is how you unlock the biggest savings. FleetRabbit tracks all of these automatically. Start your free trial and see your fleet's score in real time.
Hard Braking Events
Sudden deceleration signals tailgating, distraction, or aggressive driving. Insurers weight this heavily. Target: fewer than 5 hard braking events per 1,000 miles.
Speeding Frequency
Time spent above posted limits is one of the top predictors of claim frequency. Even moderate speeding (5–10 mph over) increases premiums. Target: under 2% of trip time at excess speed.
Rapid Acceleration
Aggressive acceleration increases fuel consumption, mechanical wear, and accident risk. Smooth acceleration is a key safe-driving indicator tracked by PHYD models.
Total Miles Driven
The foundation of PAYD models. Every mile is exposure. Fleets that actively route-optimize and reduce deadhead miles save on both fuel and insurance premiums.
Night Driving Hours
Driving between 11 PM and 5 AM carries 3× higher accident rates. Insurers penalize high night-driving ratios. Scheduling shifts to daylight hours directly improves your score.
Phone Distraction Detection
Modern telematics apps detect phone use while moving. Distracted driving violations trigger premium surcharges. Zero-tolerance policies with real-time alerts reduce incidents quickly.
Your Telematics Data = Lower Premiums
FleetRabbit captures all 6 insurance-critical metrics in real time — hard braking, speeding, acceleration, mileage, night hours, and distraction events. Your data is organized into insurer-ready reports that prove your fleet deserves better rates.
How Telematics Technology Powers UBI Programs
UBI isn't possible without the right data collection infrastructure. There are four primary telematics technologies used to feed UBI programs, each with different coverage levels and installation requirements.
Four Ways to Collect UBI Data
OBD-II Dongle
Plugs directly into the vehicle's onboard diagnostics port. Easy to install, no wiring required. Captures engine data, speed, RPM, and fuel consumption. Most widely used for retrofitting existing fleets.
Smartphone-Based Telematics
Uses driver's mobile device GPS and accelerometer to track behavior. Lower hardware cost but dependent on phone presence and app activation. Good for owner-operator situations.
Black Box / Aftermarket Device
Hardwired into the vehicle. Captures the most comprehensive data including video, impact sensing, and engine diagnostics. Cannot be removed or tampered with — insurers often prefer this.
Embedded OEM Telematics
Factory-installed in newer truck models. Provides the richest dataset — manufacturer-level diagnostics, predictive maintenance signals, and seamless integration with fleet management platforms like FleetRabbit.
The Real ROI: What Lower Premiums Actually Mean
Insurance is one of the largest fixed costs in fleet operations. A meaningful premium reduction doesn't just lower one line item — it compounds across your entire cost structure. Here's what the numbers look like for fleets that implement telematics-backed UBI.
Savings estimates based on 2026 market data from Munich Re and industry UBI benchmarks. Actual savings vary by carrier and fleet profile. Book a demo to calculate your fleet's specific opportunity.
Common Mistakes Fleets Make with UBI Programs
UBI can cut your premiums significantly — but only if you approach it correctly. Many fleets enroll in UBI programs and then leave savings on the table because of avoidable errors.
What to Avoid
Not Training Drivers on What's Being Tracked
Drivers who don't know which behaviors affect premiums can't improve them. Sharing real-time scores creates immediate behavioral change.
Choosing PHYD When PAYD Fits Better
A fleet with imperfect drivers but low mileage may save more with PAYD. Always model both scenarios before committing to a program type.
Inconsistent Telematics Coverage
If only some vehicles are tracked, insurers see gaps in data. Incomplete coverage weakens your risk score and may disqualify you from the best tiers.
Not Reviewing Data Before Renewal
Many fleet managers wait until renewal to look at their telematics score. By then, it's too late to fix problem patterns. Monthly reviews are the standard.
Using Manual Data Collection
Spreadsheet-based mileage tracking introduces errors and gaps. Insurers want verified, tamper-proof data. Automated systems like FleetRabbit produce audit-ready reports.
Ignoring Secondary Benefits
UBI data also reduces fuel costs, catches maintenance issues early, and improves driver retention. Fleets that only track insurance savings miss the full picture.
How FleetRabbit Makes UBI Work for Your Fleet
FleetRabbit is built for exactly this use case. Our platform integrates with your existing telematics hardware — or helps you deploy new sensors — and transforms raw vehicle data into a clean, insurer-ready risk profile. Every metric that matters to your underwriter is captured, organized, and available in real time. Try it free with 3 vehicles and see your fleet's behavioral score within the first week.
Real-Time Driver Behavior Monitoring
Hard braking, speeding, rapid acceleration, and cornering — all tracked continuously and scored against insurer benchmarks.
GPS Mileage Verification
Tamper-proof, GPS-verified mileage data for PAYD programs. Every trip logged, every mile counted — automatically.
Insurer-Ready Reports
At renewal time, export a complete behavioral report that shows your fleet's performance across every metric underwriters care about.
Driver Coaching Dashboards
Show drivers their own scores. Fleets using driver-visible dashboards see 40–60% faster improvement in behavior metrics.
Historical Trend Analysis
Track how your fleet's risk profile changes month over month. Document improvement to negotiate better premiums at each renewal cycle.
Start Tracking What Insurers Measure
FleetRabbit customers average 18% savings on their first renewal after implementing telematics monitoring. The setup takes days, not months — and the data starts working for you immediately. No long-term contracts. No credit card required to start.
Frequently Asked Questions
Your Fleet's Data Deserves Better Premiums
Every safe mile your drivers log and every smooth brake they apply is insurance savings sitting unclaimed. FleetRabbit turns that behavioral data into verified telematics reports that earn you lower rates at renewal — automatically, continuously, and without adding work to your team.







