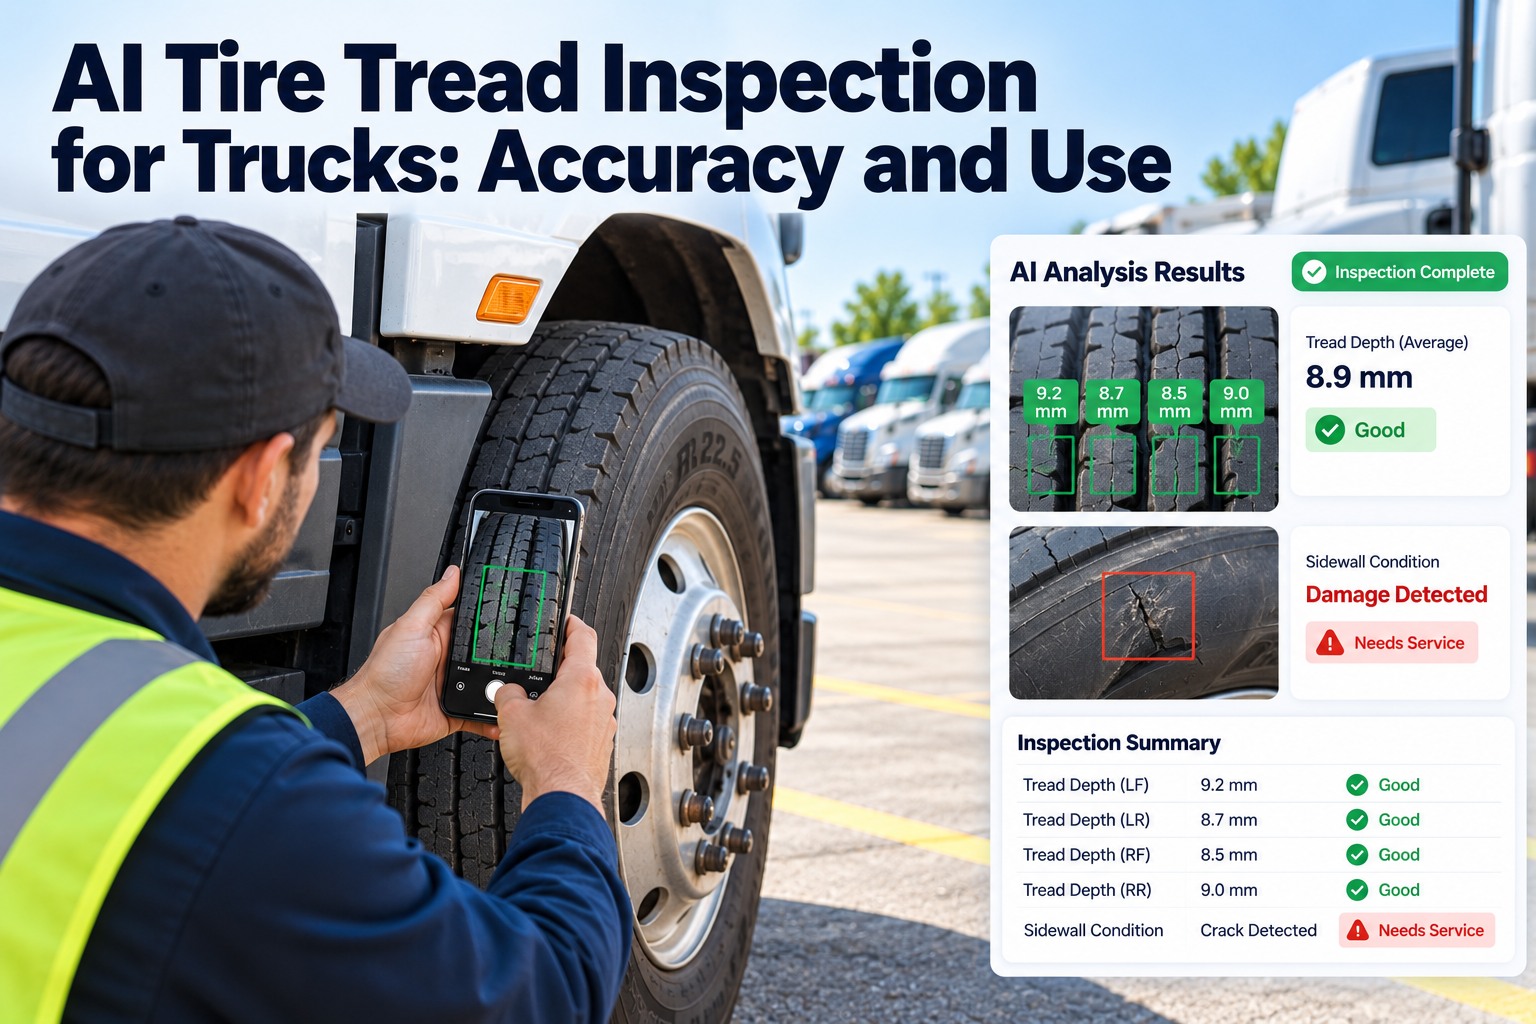
AI tire tread inspection promises two things: a depth reading from a photo or scan, and a flag when a sidewall looks damaged. Before you rely on either, you need to know what the law requires, how accurate the readings are and what a gauge still does better. This page covers the federal limits, why manual readings vary, how AI measures tread, where it falls short and how to act on the results. Schedule a call to put tire inspections on your trucks.
The Federal Tire Limits Any AI Tread Inspection Has to Be Measured Against
Steer tires need 4/32 inch, other positions 2/32, measured in a major groove, and some damage ends the discussion
| Federal rule (49 CFR 393.75) | Requirement |
|---|---|
| Steer tires | At least 4/32 inch (3.2 mm), measured in a major tread groove |
| All other tires | At least 2/32 inch (1.6 mm), measured in a major tread groove |
| Where not to measure | Not where tie bars, humps or fillets are |
| Never run | Body ply or belt exposed through tread or sidewall, any tread or sidewall separation, a flat or audible leak, a cut exposing ply or belt |
The figures come from 49 CFR 393.75 as published by Cornell's Legal Information Institute. A trade-press summary adds that CVSA out-of-service criteria include inflation at 50 percent or less of the sidewall marking, and that CVSA issues updated criteria each April, so check the current edition. FMCSA's 2016 final rule defined a major tread groove as the space between adjacent ribs or lugs that contains a wear indicator.
| Minimum | Inches | Millimeters (our conversion) |
|---|---|---|
| Other positions | 2/32 | about 1.6 |
| Steer | 4/32 | about 3.2 |
| Vendor precision claim | about 0.6/32 | 0.5 |
Why Manual Tread Gauge Readings Vary From Technician to Technician and From Groove to Groove
A gauge is only as consistent as where and how it is placed, which is the problem AI scanning claims to solve
Anyline, which sells tire scanning, lists seven sources of variation in manual readings, shown below. Its article gives no tolerance figure for manual gauges, so we cannot say how large the errors typically are. It is vendor content and the framing favours scanning.
How AI Measures Tread Depth and Spots Tire Damage From Photos and 3D Scans
Phone-photo models estimate depth with a neural network, and scanners capture the tread surface as points
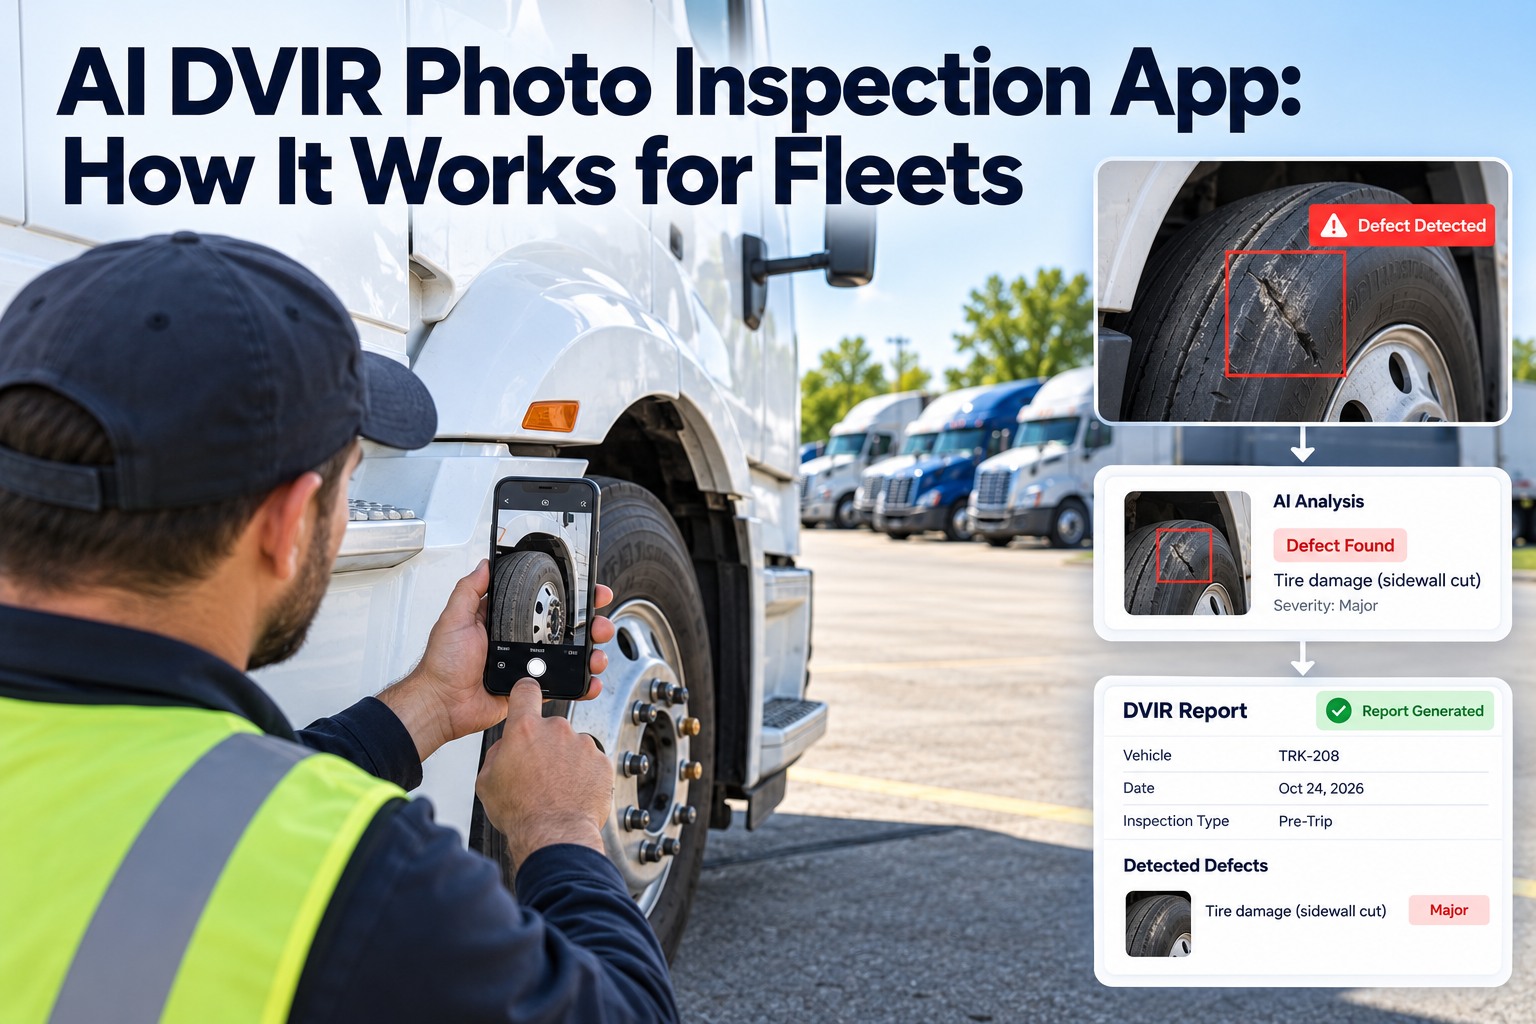
Taazaa describes a Goodyear proof of concept in which labeled tire images were converted to grayscale, edges and contours were extracted and a CNN predicted depth, with outputs such as Good, Getting Worn and Change Now. It says the model reached the desired accuracy but gives no figures, and calls the work a feasibility study. Anyline says its scanner captures about 100,000 points across the tread with precision down to 0.5 mm.
Where AI Tire Inspection Beats a Hand Gauge and Where It Falls Short
Consistency and records are real advantages, while accuracy, bad conditions and hidden damage are open questions
| Where AI tends to help | Where it can fall short |
|---|---|
| Covers the whole tread, not one or two probe points | Accuracy is rarely published, only precision or match rates |
| Same method every inspection, so readings compare over time | Wet, muddy or dark conditions are not addressed by the vendors we read |
| Dated visual record per inspection | Internal damage and air loss are not visible in a photo |
| No gauge seating or probe placement error | The legal measurement is in a major groove, so confirm the model reads there |
The left column reflects what vendors describe, and the right column is our own reasoning, because the vendors we read publish no accuracy data or failure modes. One point worth noting: a precision of 0.5 mm is about 0.6/32 inch, and the margin between a 2/32 tire and the legal limit can be smaller than that. The chart shows our conversion.
How Accurate Is AI Tread Depth Measurement? What the Sources Actually Report
No source we found gives independent accuracy data, so treat every figure as a claim to test
| Source | Claim | Status |
|---|---|---|
| Goodyear proof of concept built by Taazaa | CNN estimates tread depth from phone photos | Names the metrics but reports no values; feasibility study only |
| Anyline TireBuddy page, Aug 2026 | About 100,000 points per tread, precision to 0.5 mm | Vendor figure; precision is not accuracy; no independent test |
| OxMaint page, Sep 2026 | 92% consistency across technicians; 5 to 8 minutes manual vs under 1 minute | Vendor page; metric undefined; sources not given; one figure contradicts its own FAQ |
| Fleet gauge practice | No published tolerance for manual gauges in the sources we read | Display resolution is not accuracy |
Acting on the Result: Set a Pull Point Above the Legal Minimum and Tie Every Reading to a Wheel Position
A pull point is a fleet policy choice, so the legal minimum is the floor, not the target
FleetRabbit's tire page describes the pull point as a fleet policy decision, not a regulation. Set yours above the 4/32 and 2/32 minimums so a measurement error of the size in the chart does not put a tire out of service, and record each reading by wheel position so repeated patterns, such as feathering on one steer position, show up.
How FleetRabbit Handles Tread Depth, Pressure and Wear Patterns by Wheel Position
Readings and tire reports are kept per position, and you confirm what AI measurement is included on a call
FleetRabbit's tire page says it records tread depth, pressure and wear pattern by wheel position, flags positions that keep producing the same pattern, turns a driver tire report into a work order with that position's history and offers pull-point and casing disposition settings on the free plan. It does not describe AI measuring tread from photos, and gives no accuracy figures, so confirm that in a demo. Free for up to 3 vehicles, then $5 per vehicle per month.