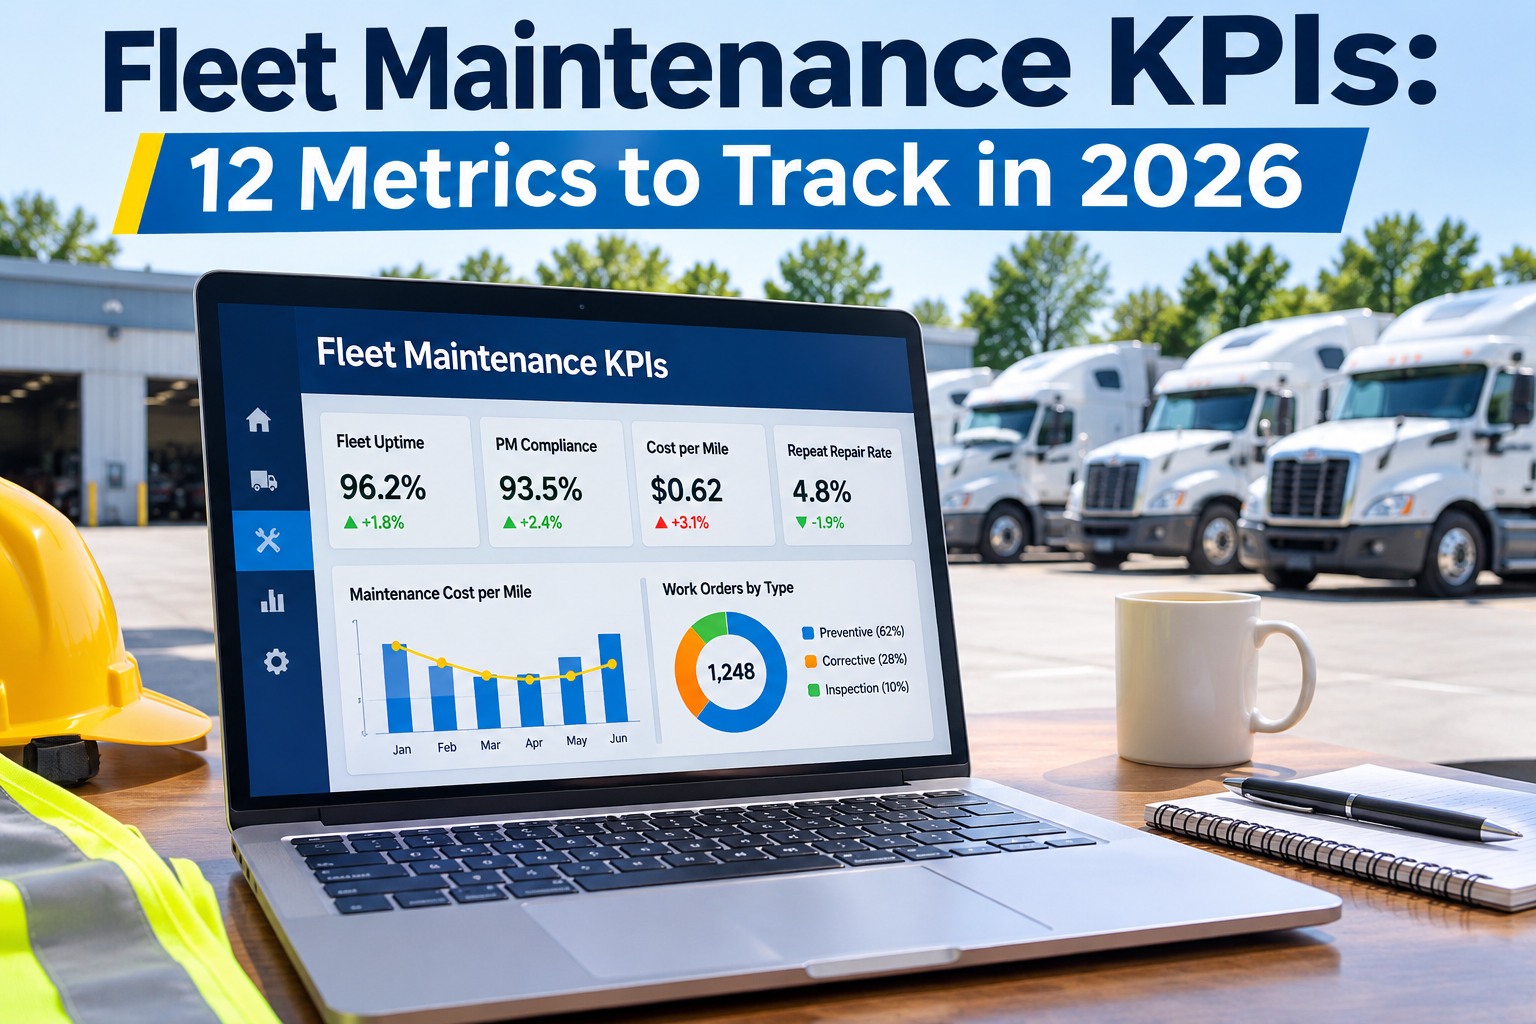
Fleet maintenance KPIs turn repair records into a handful of numbers you can review every week: uptime, PM compliance, cost per mile, repeat repairs and more. This guide lists 12 metrics with formulas, shows what published benchmarks say and where they disagree, and explains how to build a dashboard you will actually use. Schedule a call to build your KPI dashboard.
Fleet Maintenance KPIs Explained: Twelve Metrics, Their Formulas and What Each One Tells You
Each metric is a ratio, so write down what counts in the top and the bottom before you start
The formulas below follow one widely used 12-metric guide. Definitions vary between sources, and the biggest difference we found is availability: one source counts vehicles available, while another calculates it from MTBF and MTTR.
| KPI | Formula | What it tells you |
|---|---|---|
| 1. Fleet availability rate | Vehicles available / total fleet x 100 | Share of the fleet ready to work |
| 2. Vehicle downtime | Hours out of service / number of vehicles | How long units sit; split planned from unplanned |
| 3. MTBF | Total operating time / number of failures | How long units run between failures |
| 4. MTTR | Total repair time / number of repairs | How fast a unit comes back |
| 5. Maintenance cost per mile | Total maintenance cost / total distance | Cost trend by unit or class |
| 6. Maintenance cost per vehicle | Total maintenance cost / fleet size | Outliers worth a replace-or-repair look |
| 7. Planned vs unplanned ratio | Planned maintenance hours / total maintenance hours x 100 | How mature the PM program is |
| 8. Parts cost share | Parts cost / total maintenance cost x 100 | Whether parts or labor drive spend |
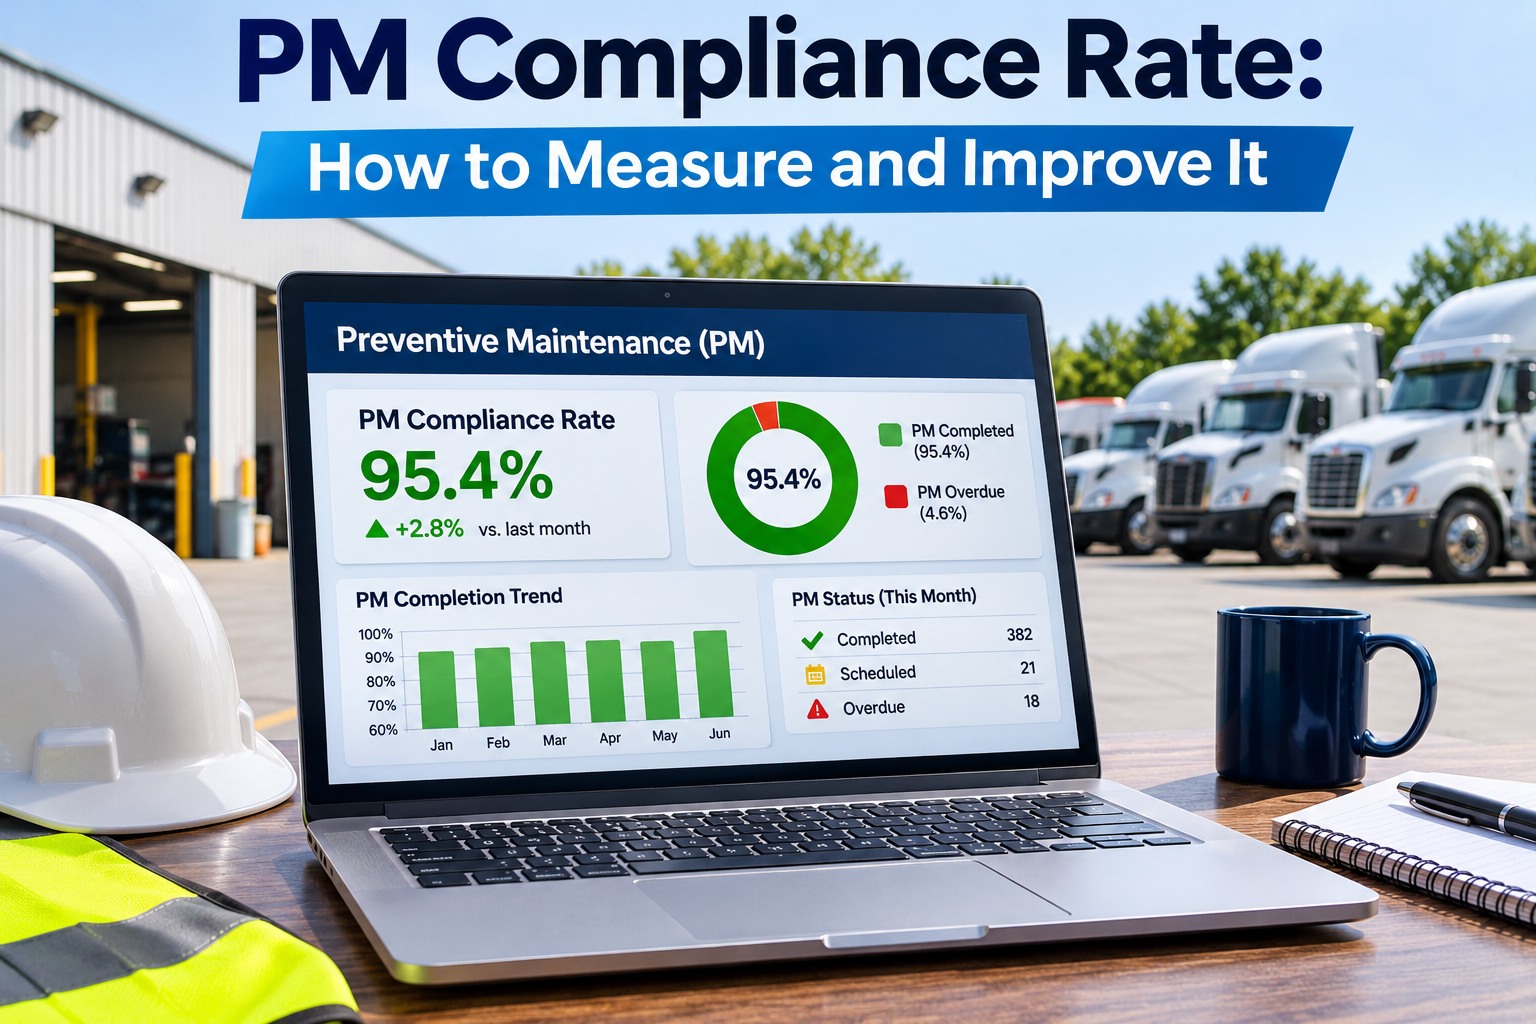
| 9. PM compliance rate | PMs completed on time / PMs scheduled x 100 | Whether the PM schedule is being kept |
| 10. Work order completion rate | Work orders completed on time / total work orders x 100 | Shop productivity and backlog |
| 11. Repeat repair rate | Repeat repairs / total repairs x 100 | Diagnosis, parts or training gaps |
| 12. Roadside breakdown rate | Breakdowns / total miles x 1,000 | Failures that reach the road |
Fleet Maintenance KPI Benchmarks for 2026: What Published Targets Say and Why to Set Your Own Baseline First
Published targets are mostly unsourced vendor figures, and the sources disagree with each other
None of the benchmark tables we reviewed named a study, dataset or year. One of the guides itself says your own baseline matters more than outside numbers. Use the ranges to sense-check, then track three months of your own data before you set a target.
| KPI | Published targets we found | Caveat |
|---|---|---|
| PM compliance | 90 percent or more (Maintainly), 95 percent or more (HVI), top group 94 to 98 and average 82 to 88 (FleetRabbit government page) | No source named for any of them |
| Fleet availability | 95 percent or more; 93 percent or more for standard fleets (HVI); 95 to 98 percent target (FleetRabbit) | HVI defines it as MTBF / (MTBF + MTTR), not a head count |
| Planned share | 80 percent or more (Maintainly, FleetRabbit); 70 to 80 percent (HVI) | The sources do not agree |
| Repeat repair | Under 5 percent within 30 to 90 days (Maintainly); under 3 percent at 30 days is top (FleetRabbit) | Window and definition differ |
Which Fleet Maintenance KPIs to Track First: Four Groups and a Starting Set of Five
Do not start with twelve; start with the five that cover every group
Fleet Maintenance KPI Mistakes to Avoid: Missing Definitions, Small Samples and Hidden Outliers
Three problems make a dashboard look precise while saying little
MTBF and MTTR need care. One reliability guide warns not to compare dissimilar assets or read one value alone, and notes that long repair times are often caused by parts or approvals, not the repair itself.
How to Build a Weekly Fleet Maintenance Dashboard: Definitions, Data Sources and a Review Routine
A dashboard is only useful if somebody owns each number and reviews it on a schedule
How FleetRabbit Handles Fleet Maintenance KPIs: Formulas, PM Intervals, Overdue Views and Reports
What FleetRabbit pages say about KPIs and maintenance reporting
| KPI need | What FleetRabbit pages describe |
|---|---|
| Definitions | FleetRabbit gives formulas for PM compliance, fleet availability, planned ratio and unit cost per mile or engine hour |
| PM intervals | PMs can be scheduled by mileage, engine hours or time, and work orders are generated when an interval is reached |
| Overdue view | Dashboards show upcoming, overdue and in-service vehicles with color-coded alerts |
| Reports | Reports support analysis of maintenance costs, compliance rates and technician productivity |
| Repair metrics | FleetRabbit articles suggest mean time to repair, first-time fix rate and planned to reactive ratio |
FleetRabbit pages define formulas but do not say what counts as available or on time, so settle those definitions in a demo. Its government fleet page also shows a sample scorecard without saying whether the numbers are live data.
Fleet Maintenance KPIs FAQs: Formulas, Benchmarks, PM Compliance, Cost per Mile and Dashboards
Short answers for fleet managers
What are the most important fleet maintenance KPIs?
Start with PM compliance, fleet availability, maintenance cost per mile, repeat repair rate and mean time to repair. Together they cover uptime, reliability, cost and program health. Add others, such as planned ratio and roadside breakdown rate, once the data is trusted.
How do I calculate maintenance cost per mile?
Divide total maintenance cost by total distance driven over the same period. Use the same cost categories every time, and compare by vehicle class, because benchmarks vary widely by vehicle type and use. Track the trend against your own baseline.
What is a good PM compliance rate?
Published targets are 90 percent or more in one guide and 95 percent or more in others, with FleetRabbit citing 94 to 98 percent for top fleets. None names a source, so measure your own baseline first and decide how you define on time.
How do I define a repeat repair?
Pick a rule and apply it every time. One guide counts a repair as repeat if the same issue is redone within roughly 30 to 90 days, and FleetRabbit uses 30 days. A common choice is the same truck and the same system within your chosen window.
How often should I review fleet KPIs?
Review the dashboard weekly, with a named owner for each number, and look at outliers by unit each month. A monthly look alone can be too slow to catch problems such as rising repair times or a drop in PM compliance.
Where do I start with FleetRabbit?
Start with five KPIs, write down the definitions, and connect them to your work orders and PM schedule. Ask how each formula is calculated and what counts as on time or available before you set targets. Try the maintenance dashboard in FleetRabbit.