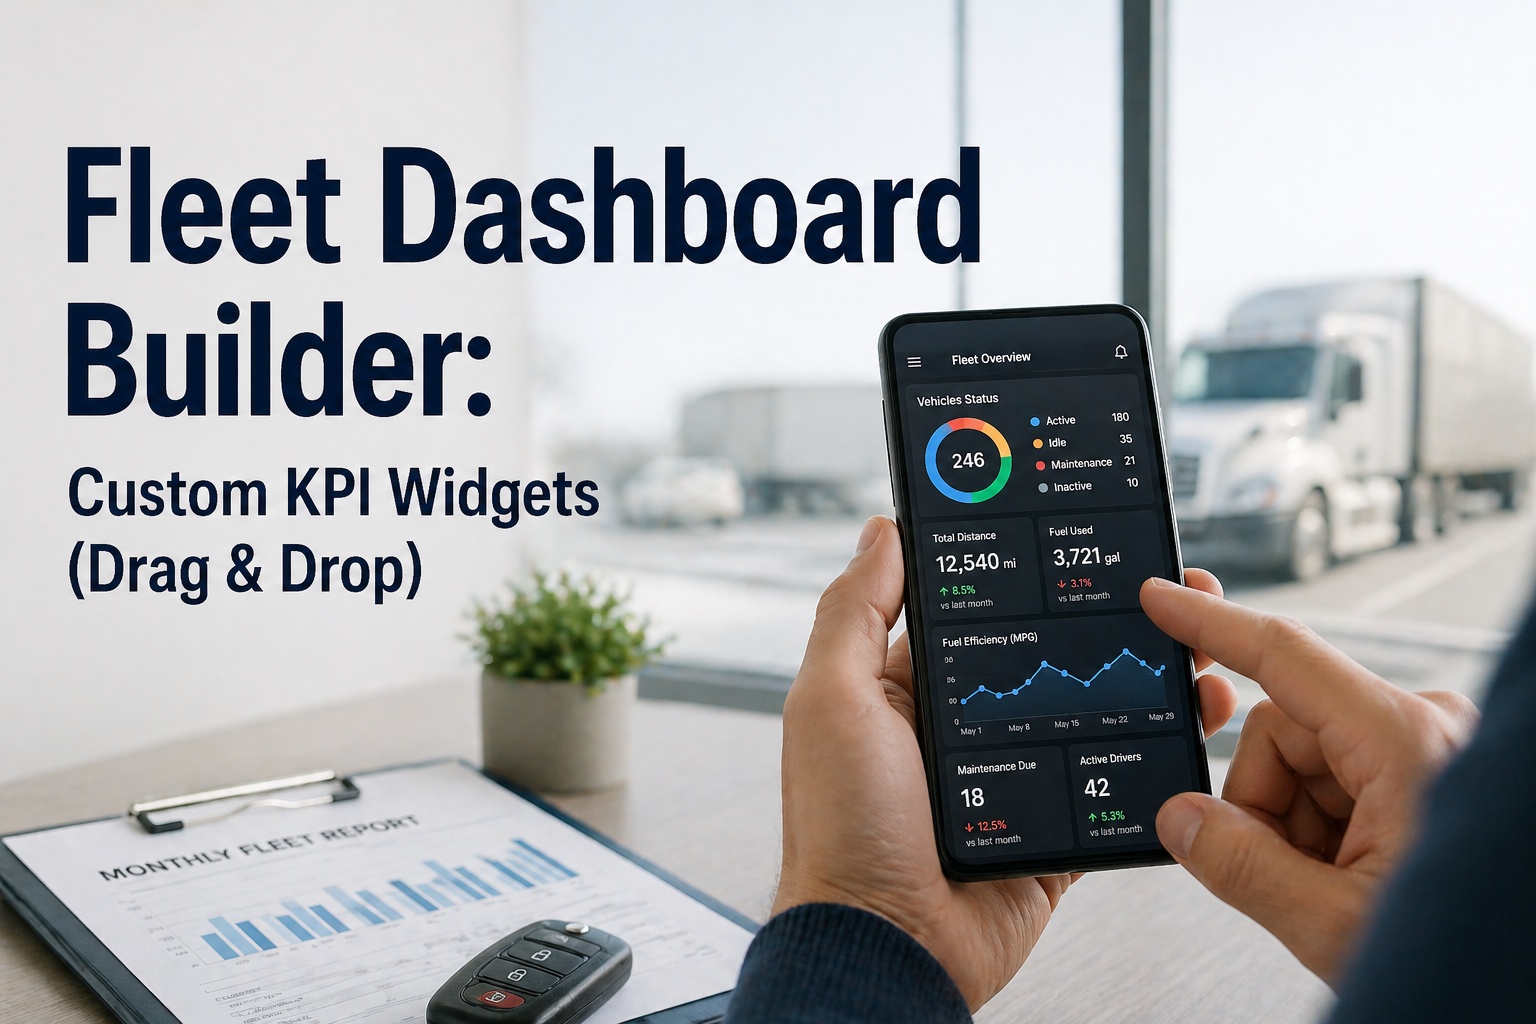
Most fleet software shows you 30 KPIs on the same screen with equal visual weight. The result: dashboard fatigue. Managers stop looking. The fleets actually using their data have something different a customizable dashboard where each role (CFO, ops manager, dispatcher, maintenance lead, driver) sees only the 4-8 KPIs that matter to their job, drag-and-drop arranged the way their brain works. Fleet Rabbit's Configurable KPI Widgets let any user build their own dashboard in under 5 minutes — no IT ticket, no training session, no admin approval. This guide covers the 40+ widgets available, the 5 role-based dashboard templates, how to build a custom view, and why "the right 6 KPIs" beats "all 30 KPIs" every single time.
Stop Drowning in 30 KPIs. See the 6 That Matter.
Most fleet software dumps every metric on one cluttered screen — managers stop looking. Fleet Rabbit lets each role build their own view in under 5 minutes. CFOs see cost. Dispatchers see the live map. Maintenance sees work orders. Same data, the right view per person.
Quick Overview — How It Works
| Who can build dashboards? | Any user with a Fleet Rabbit login. No admin approval required. |
| How long does it take? | ~5 minutes from blank canvas to live dashboard. |
| Can I have multiple dashboards? | Yes — unlimited. Build different views for different days, projects, or stakeholders. |
| Are dashboards shareable? | Yes. Share by role, team, or specific user. Read-only or edit access. |
| Is mobile supported? | Yes. Dashboards auto-reflow to single column on phone with critical KPIs at the top. |
| How fresh is the data? | Real-time for vehicle status, 15-30 min for operational metrics, daily for financial KPIs. |
The 5 Role-Based Dashboard Templates
Start from scratch or pick a pre-built template designed for your role. Each one ships with the right 4-8 KPIs for that role's daily decisions — fully customizable from there.
The 40+ Widgets Available
Drag any widget onto your dashboard. Most carriers use 4-8 widgets per view — more than that creates dashboard fatigue and slows decision-making.
Widget Types — Pick the Right Visual
Each KPI widget renders in one of six formats. Pick the one that makes the data immediately clear at a glance.
Single big number with delta vs prior period. Best for top-line KPIs like cost per mile, utilization rate, total active trucks.
Line chart showing direction over 7/30/90 days. Best for spotting trends — fuel cost, maintenance spend, downtime trajectory.
Comparative bars across vehicles or time periods. Best for ranking — top fuel-burning trucks, highest-cost assets, busiest routes.
Circular or horizontal gauge showing progress toward target. Best for compliance %, PM completion rate, audit readiness.
Compact rows with traffic-light indicators. Best for fleet status, driver status, work order priority list.
Real-time vehicle positions with status overlays. Best for dispatcher view — active trucks, idle assets, route progress.
How to Build Your Dashboard — 4 Steps
Open the dashboard builder. Choose one of 5 role templates (CFO, Ops, Dispatch, Maintenance, Driver) or start with a blank canvas. Templates pre-load the most common 4-8 widgets for that role.
Browse the widget library, drag any of 40+ widgets onto your dashboard. Resize by dragging corners. Reorder by dragging the widget header. Right-click any widget to duplicate or remove.
Set target ranges for each KPI — green/amber/red thresholds. Configure alert rules for critical breaches (e.g. "alert me when CPM exceeds $0.50" or "notify when PM compliance drops below 85%").
Save your dashboard with a name. Set sharing permissions: private, team, or company-wide. Read-only or edit access. Set as your default view or switch between multiple saved dashboards.
Most fleet managers build their first dashboard in under 5 minutes. Power users typically maintain 3-5 dashboards for different contexts (daily operations, weekly review, monthly P&L, audit prep, board meetings). See the Dashboard Builder in Action →
Best Practice — The 4-8 Widget Rule
Industry research and customer telemetry agree: dashboards with 4-8 widgets on the main view drive faster decisions than dashboards with 15+ widgets. The fleets actually using their data follow this pattern.
| Widget Count | What Happens | Decision Speed |
|---|---|---|
| 1-3 widgets | Too narrow. Missing critical context. Forces multiple dashboard switches. | Slow (multi-step) |
| 4-8 widgets | Sweet spot. All key metrics visible without overwhelming. Fast prioritization. | <10 seconds |
| 9-14 widgets | Increasing fatigue. User scans without absorbing. Trend visibility starts dropping. | Medium |
| 15+ widgets | Dashboard fatigue. User stops looking entirely. Defeats the purpose of the tool. | Information ignored |
Real-Time Refresh — How Often Each Metric Updates
| KPI Type | Refresh Rate | Why |
|---|---|---|
| Vehicle location / status | Real-time (live) | Dispatcher needs current position constantly |
| HOS clock / driver status | Real-time (live) | Critical for compliance decisions |
| Active work orders | Every 5 min | Maintenance team needs near-current state |
| Operational KPIs | Every 15-30 min | Operational decisions don't need second-by-second updates |
| Maintenance metrics | Every 30 min | Trends matter more than instant changes |
| Financial KPIs (CPM, spend) | Daily | Daily aggregation prevents noise from skewing decisions |
| Compliance scores | Weekly (SMS update cycle) | FMCSA updates SMS on first Friday of each month |
Frequently Asked Questions
Do I need IT or admin help to build a dashboard?
No. Any Fleet Rabbit user can build their own dashboards from their own login. No admin approval, no IT ticket, no training required. The drag-and-drop interface is designed for non-technical fleet managers, dispatchers, and drivers.
Can different users see different dashboards?
Yes — that's the point of role-based personalization. The CFO sees financial KPIs first. The dispatcher sees the live map first. The maintenance lead sees work orders first. Each user logs in to their own custom dashboard and accesses other views on demand. See Role-Based Templates →
What data sources feed the widgets?
All Fleet Rabbit modules feed widgets automatically: telematics (Samsara, Geotab, Verizon Connect, Motive), ELDs, fuel cards (TCH, EFS, Comdata, WEX), maintenance records, DVIRs, work orders, and FMCSA SMS data. No manual data entry. No spreadsheet uploads. Data flows continuously.
Can I export dashboard data to Excel?
Yes. Every widget supports one-click Excel export with custom date ranges. Most users export monthly for stakeholder reports or audit prep. The full dashboard can also be exported as a PDF snapshot for board meetings.
Can I create custom KPIs not in the 40+ library?
Yes. Custom widgets let you define any metric using fields from your fleet data — for example, "fuel cost per ton-mile for refrigerated routes only" or "MTTR by mechanic." Build it once, save it, share it across the company. See Custom Widget Builder →
How is the dashboard builder priced?
Included in the standard $3/vehicle/month subscription — no per-user fee, no per-widget charge, no premium tier. Free tier (up to 3 vehicles) includes the full dashboard builder with all 40+ widgets and role templates. Book a Demo to See Pricing →
Stop using someone else's dashboard. Build the one you actually want.
40+ KPI widgets. 5 role-based templates. Drag-and-drop builder. Real-time data from your telematics, ELDs, fuel cards, and maintenance records. Custom thresholds and alerts. Multiple saved dashboards per user. Mobile-responsive. Free for up to 3 vehicles indefinitely.







