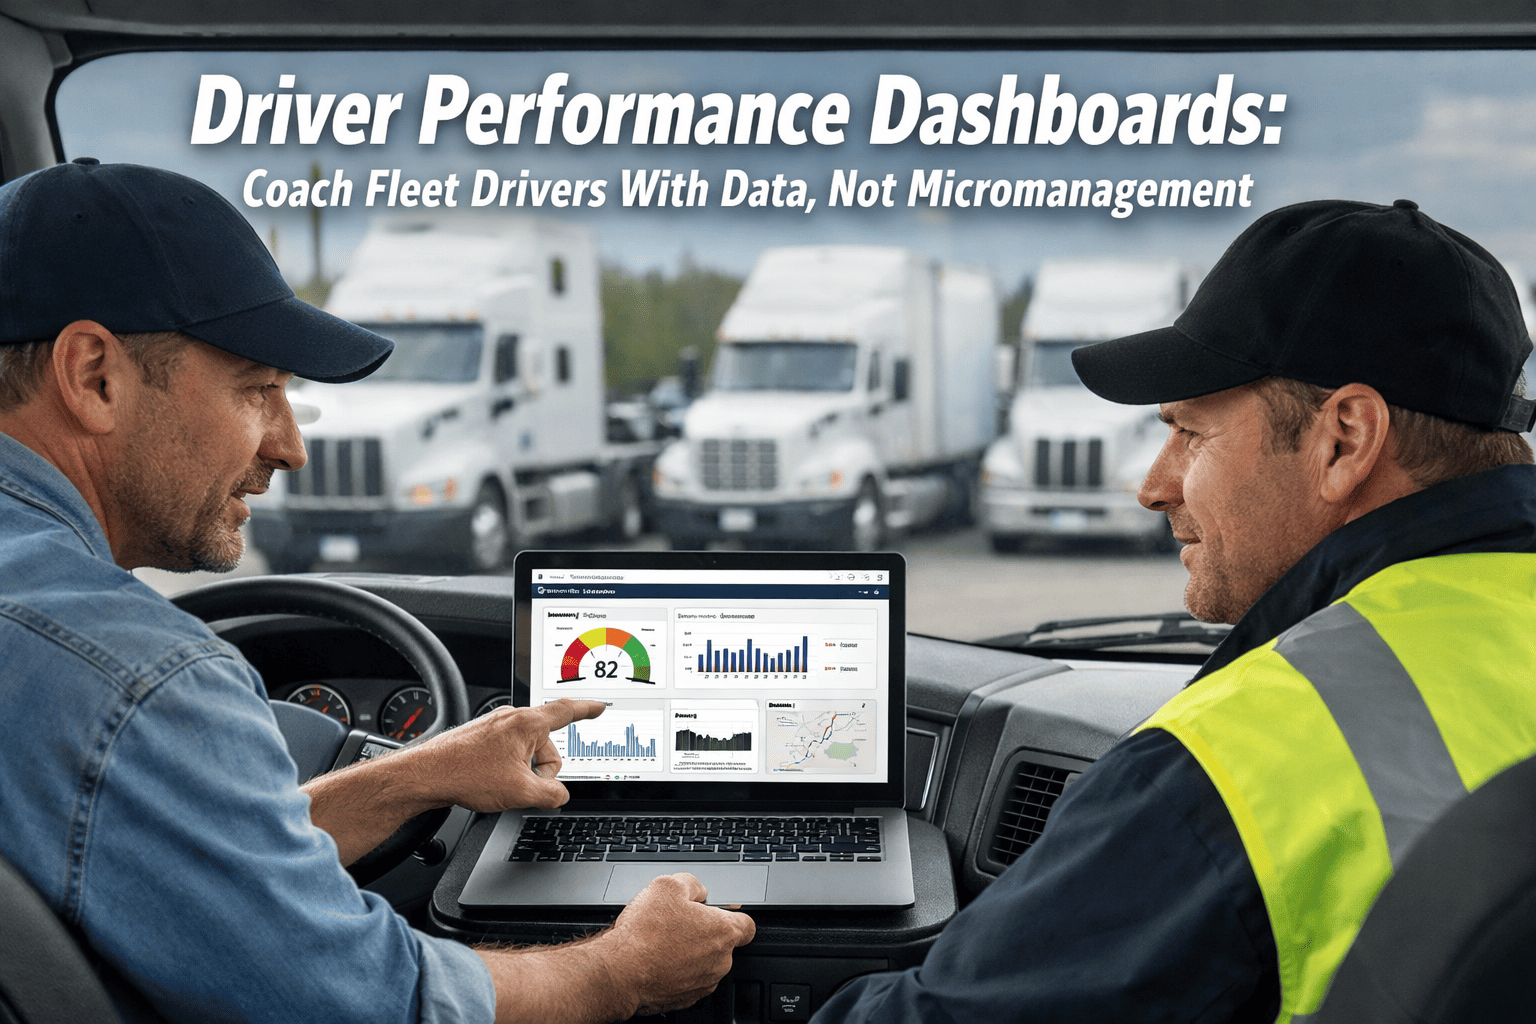
Driver performance dashboards change this — they show you exactly who needs coaching, what they're doing wrong, and how much it's costing you. No guesswork. No surveillance culture. Just data-backed conversations that actually change habits.
The Real Cost of Flying Blind on Driver Performance
Without a driver dashboard, fleet managers react to problems after they happen — after the accident, after the fuel bill, after the complaint. These are the five blind spots that cost fleets the most:
Harsh Braking
Wears brakes 40% faster. Signals distraction or tailgating — both insurance risks.
Speeding
Driving 10% over the limit burns 14% more fuel. Every ticket is a premium hike.
Excessive Idling
One idle hour burns ~1 gallon of fuel with zero productivity. Invisible without data.
Hard Cornering
Accelerates tyre wear and signals aggressive driving before an incident occurs.
HOS Violations
Hours-of-service breaches trigger audits and fines — always caught late, always preventable early.
These behaviours also trigger unexpected breakdowns. See how AI Predictive Maintenance connects driver data to vehicle health alerts — before costly failures happen.
What a Driver Scorecard Actually Looks Like
A scorecard aggregates telematics events into a single score per driver updated weekly. Here's what FleetRabbit surfaces for your fleet manager every Monday morning:
6 KPIs Every Driver Dashboard Must Track
Not all metrics are equal. These six drive the biggest impact on safety, cost, and compliance:
Harsh Braking Events
Per 100 miles driven. Over 3 events = coaching trigger. Over 5 = mandatory retraining.
Speeding Violations
Posted limit breaches, duration over limit, and max speed recorded per trip.
Idle Time %
Total engine-on hours with zero movement. Target: under 15% of total shift time.
MPG vs Fleet Average
Individual fuel economy vs. fleet baseline. The gap reveals the coaching opportunity.
HOS Compliance Rate
Hours-of-service adherence. Any violation needs same-day manager review.
Inspection Completion
% of pre/post-trip inspections completed on time. Below 90% = compliance exposure.
See Every Driver's Score in Real-Time
FleetRabbit dashboards track all 6 KPIs automatically — no manual entry, no spreadsheets.
How Behaviour Tracking Translates to Dollar Savings
Every unsafe driving event has a direct cost. Here's what FleetRabbit quantifies automatically, for your fleet:
Driver behaviour is your single biggest fuel lever. See how FleetRabbit Fuel Management connects driver scores to real-time fuel spend — and where the savings hide.
The 5-Step Data-Driven Coaching Process
Data alone doesn't change behaviour — structured coaching conversations do. Here's the exact process top fleet managers use:
Identify — Let the Dashboard Find Who Needs Help
Sort your driver scorecard by lowest score. Filter by specific behaviour. Data finds the right driver, not your gut feeling.
Time: 2 minutes per weekPrepare — Pull the Specific Trip Data
Before the conversation, review the exact incidents: which route, what time, how many events. Know the facts so the discussion is focused — not a general lecture.
Time: 5 minutes per driverDiscuss — Show, Don't Tell
Open the dashboard together. Show the driver their own data. Ask questions — "what was happening on Route B at 4pm Thursday?" This turns blame into curiosity and gets the driver problem-solving with you.
Time: 15–20 min sessionSet a Target — Specific, Measurable, Tied to a Reward
Agree on one number: "Get harsh braking events under 3 per 100 miles by next month." Attach a positive incentive. Drivers who set their own targets outperform those assigned them.
Result: 40% faster improvementFollow Up — Weekly Scorecard Check-In
Send the driver their score weekly via the app. Celebrate wins publicly. Flag backsliding privately. Consistency converts short-term change into permanent habit.
Auto-sent by FleetRabbitBefore vs. After: Driver Dashboards in Action
Results Fleets See Within 90 Days
What Each Role Sees on Their Dashboard
FleetRabbit gives every stakeholder a view tailored to their job — not a one-size-fits-all screen:
Fleet Manager View
Driver View (Mobile App)
Safety Manager View
Operations / Finance View
Safety managers need audit-ready records too. See how FleetRabbit Compliance stores coaching logs, inspection records, and DVIR documentation — always audit-ready.
Every Role Gets the Data They Need
Manager dashboards, driver mobile scorecards, safety reports — all in FleetRabbit. Start free with 3 vehicles.
Frequently Asked Questions
Frame it correctly and most drivers embrace it. Show them their own score first. Explain it exonerates them from false accident claims. Tie improvements to rewards. Fleets that involve drivers in the rollout see 80%+ adoption. FleetRabbit lets drivers see their own data — transparency builds trust.
Most fleets see a 15–25% improvement in scorecard metrics within the first 30 days of structured coaching. The biggest gains come in months 2–3 once weekly scorecard sharing becomes routine and drivers start self-correcting between sessions.
Yes — FleetRabbit integrates with 200+ telematics providers including Geotab, Samsara, and Verizon Connect. Driver behaviour data flows in automatically. No hardware replacement needed in most cases.
Yes. A fuel delivery fleet might weight idle time heavily; a school bus fleet might prioritise speed compliance. FleetRabbit lets you adjust metric weights so the score reflects what matters most to your specific operation.
Driver dashboards and scorecards are included in the core plan — free for up to 3 vehicles, then $3/vehicle/month with no contracts. Book a demo to model the ROI for your fleet size.
Want a full feature walkthrough before signing up? Read our AI Fleet Management Software deep-dive to see every capability in detail.
Stop Guessing. Start Coaching With Data.
Driver performance dashboards that score every driver, flag every risk, and make every coaching conversation count — automatically.







