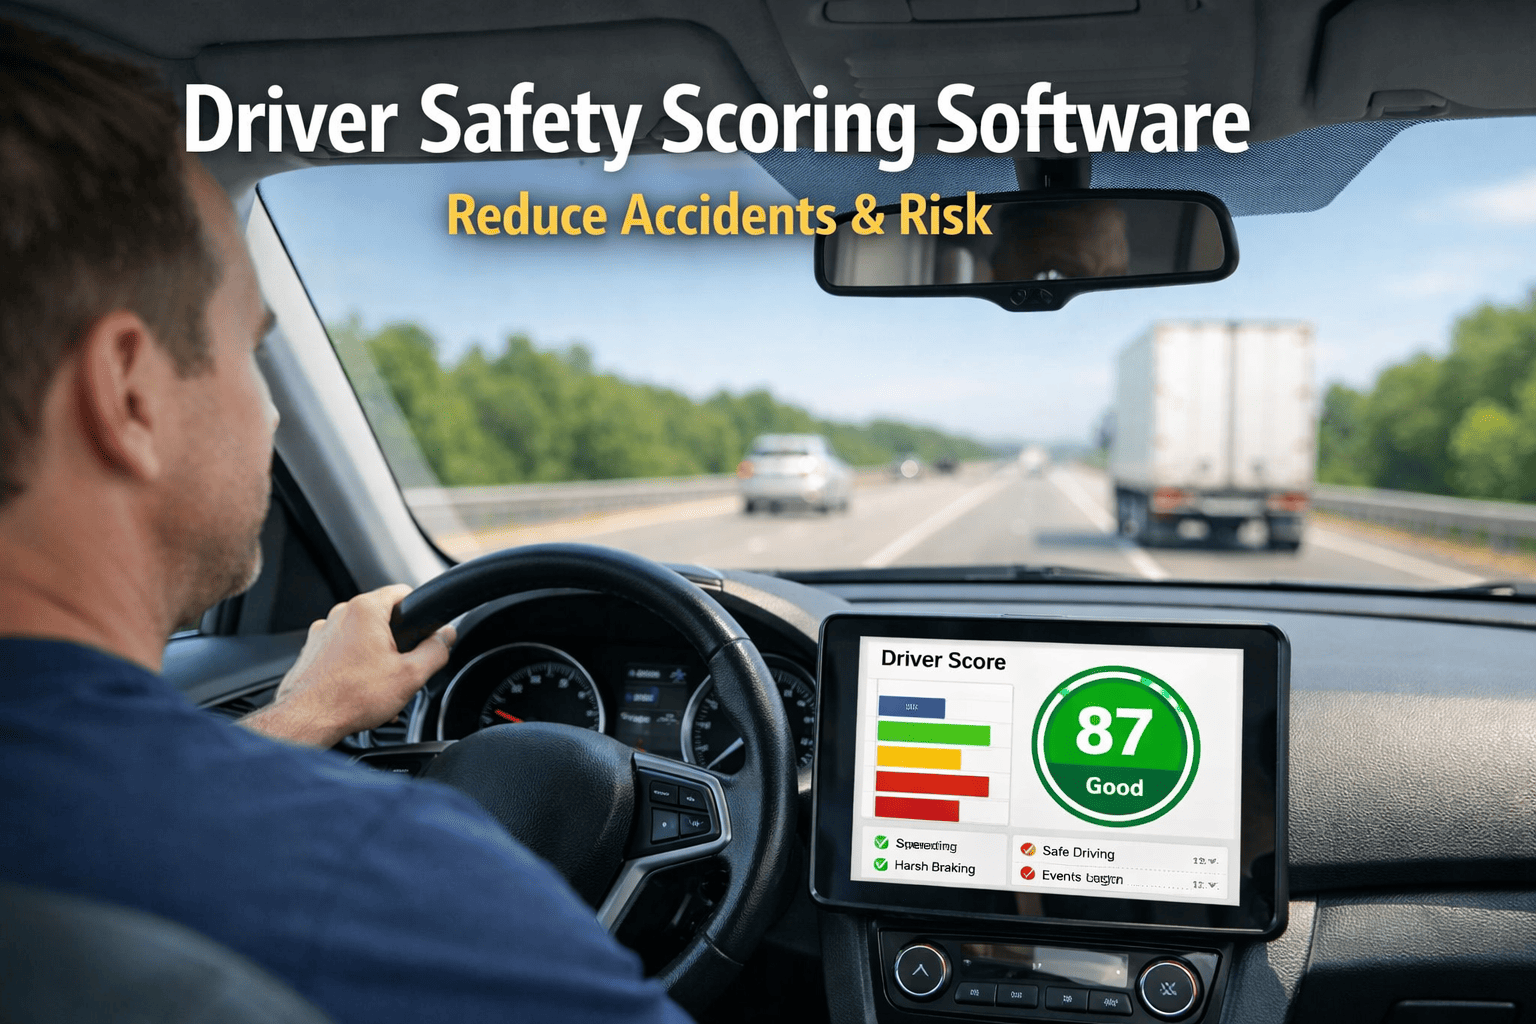
Every commercial vehicle accident your fleet avoids is worth $75,000 in direct costs saved — repairs, claims, downtime, legal exposure. That number is per non-fatal crash. Multiply it by the number of preventable incidents your fleet has in a year, and driver safety scoring stops being a "nice to have" and becomes the highest-ROI operational decision you can make. Fleets with telematics-based driver scoring reduce accidents by 25–40%. AI-integrated systems achieve up to 60% accident reduction and 86% lower accident-related costs. The data is unambiguous: the way drivers behave is the variable with the largest single impact on your fleet's safety record and your company's financial performance.
What a Driver Safety Score Actually Measures
A safety score is a composite metric — not a single event. It combines multiple behaviour data streams, weighted by severity and frequency, into a single number per driver that reflects their actual risk level across a given period. Here's what drives each component:
Want to see what your drivers' scores look like today? Schedule a demo and we'll show you a live scorecard walkthrough for your fleet type.
The 5 Behaviours That Cause 80% of Fleet Accidents
Fleet accident data consistently points to the same five behaviour categories. These aren't edge cases — they're the systematic patterns that produce the incidents your fleet will face in the next 12 months unless they're measured and coached.
Speeding
The #1 cause of at-fault fleet accidents in urban environments in 2026. Each 10mph over the limit triples stopping distance and doubles collision severity. Telematics captures every speed violation by road type, frequency, and severity — not just outlier events.
Harsh Braking
A leading indicator of following too closely, distraction, and poor anticipation. High braking frequency correlates directly with higher accident rates and significantly higher maintenance costs — brake pads wear 3× faster on drivers with poor braking scores.
Distracted Driving / Phone Use
Distracted driving is now the fastest-growing accident cause category. AI dashcams detect phone use, eating, and inattention in real time — issuing in-cab audio alerts before an incident occurs. GPS-only telematics cannot detect this behaviour.
Aggressive Acceleration
Rapid acceleration patterns signal aggressive driving styles that increase accident probability, fuel waste, and vehicle wear simultaneously. Drivers with top-quartile acceleration scores consume 18% more fuel and have 2.5× higher accident rates than bottom-quartile drivers.
Seatbelt Non-Compliance
Drivers not wearing seatbelts face 30× higher fatality risk in rollovers. Beyond the human cost, unbelted driver fatalities expose employers to catastrophic liability. Telematics detects buckle status continuously — creating a completionrate record that protects the company in litigation.
Driver behaviour is one side of fleet safety. Vehicle health is the other. See how FleetRabbit AI Predictive Maintenance catches brake wear, tyre degradation, and mechanical failures caused by aggressive driving — before they turn a safety issue into a breakdown.
From Score to Action: How Driver Coaching Actually Works
A score that doesn't change behaviour is just a number. The most effective driver safety programmes build a closed coaching loop — measure, surface, discuss, improve, repeat — with specific data backing every conversation.
Behaviour Captured
Every trip generates telematics events — timestamped, severity-rated, and GPS-located. Events are scored individually and aggregated into the weekly safety score.
Scorecard Delivered
Driver receives weekly scorecard via mobile app and email. Score, rank vs. peers, trend vs. prior week, and specific events that moved the score shown clearly.
Manager Coaches on Data
Fleet manager reviews bottom 20% scores and schedules coaching sessions backed by specific event clips and frequency data. Conversation is factual, not confrontational.
Behaviour Improves
Score improvement tracked week over week. Drivers seeing their own data improve voluntarily — gamification and peer comparison drive competitive self-improvement without management pressure.
Coaching conversations are most effective when they're specific. See how FleetRabbit Driver Performance Dashboards give fleet managers timestamped event detail, video clips, and trend comparisons — turning coaching from a general conversation into a data-backed session with a clear improvement target.
The Financial Impact of Driver Safety Scoring
Accident Cost Reduction
Saved per prevented non-fatal crash — repairs, downtime, claims, legal fees. A 50-vehicle fleet preventing just 3 accidents annually saves $225,000. Fleets achieving 40% accident reduction save millions over 3 years.
Insurance Premium Reduction
Average insurance premium reduction for fleets providing telematics-documented safety score data to underwriters. In 2026, most major commercial fleet insurers offer usage-based pricing tiers that reward documented score improvement.
Maintenance Cost Savings
Safer driving directly reduces wear-and-tear costs. Fewer harsh brake events extend brake pad life. Reduced aggressive acceleration cuts tyre wear. Fleets report 20–35% maintenance cost reductions as a direct byproduct of safety score improvements.
Fuel Efficiency Improvement
Coaching harsh acceleration and speeding simultaneously improves fuel economy. Drivers improving from "Needs Coaching" to "Above Average" consistently show 8–15% better MPG — a direct fuel cost saving on top of accident reduction.
FleetRabbit safety scoring costs $3/vehicle/month — $1,800/year for 50 vehicles.
That's a potential 242× ROI before the first coaching session.
Safety scores connect to your complete fleet cost picture. See how FleetRabbit Fleet Analytics and Reporting combines safety event data, maintenance costs, and fuel efficiency into one dashboard — so you can see the full ROI of your safety programme in one view.
FleetRabbit Driver Safety Scoring: What's Included
Composite Safety Score
6-behaviour weighted composite score updated weekly per driver. Configurable weightings for your fleet type. Trend lines, percentile ranking, and peer comparison built in.
Real-Time In-Cab Alerts
Configurable audio alerts via driver mobile when speeding, harsh braking, or distraction detected. Corrects behaviour in the moment — before the event becomes a score impact or an incident.
Fleet Manager Dashboard
Top 10 / bottom 10 driver rankings. Fleet-wide score trend. Individual driver event drill-down. Coaching queue automatically populated by lowest-scoring drivers needing priority attention.
Automated Coaching Workflows
Drivers below configurable threshold automatically flagged for coaching. Coaching notes and completion logged per session. Score improvement attributed to specific coaching programme for ROI documentation.
Insurance Documentation Package
Per-driver scorecard history, fleet-wide behaviour trend data, coaching session logs — formatted in the exact package that commercial fleet underwriters request for usage-based premium assessment.
200+ Telematics Integrations
Safety scoring works with your existing Geotab, Samsara, Verizon Connect, Motive, or OEM telematics hardware. No hardware replacement. Data starts flowing to scoring models immediately on connection.
Frequently Asked Questions
Yes — the correlation is well-documented across multiple independent studies. The National Safety Council found that driver coaching combined with dashcams reduced safety-related events by 52%. JSR research showed dual-facing dashcam programmes achieved 60% accident reduction and 86% lower accident-related costs. The mechanism is well understood: when drivers know specific behaviours are measured and scored, they self-correct. When coaching is backed by specific event data rather than general feedback, behavioural change is faster and more durable.
Driver acceptance depends heavily on how the programme is introduced. Programmes that present scoring as a tool for driver recognition and coaching — not surveillance — consistently achieve 80%+ voluntary adoption. Key factors: transparency (drivers see their own scores and the data behind them), fairness (all drivers scored on the same criteria), and upside (gamification, recognition, and incentives for top performers). FleetRabbit's driver-facing scorecard is designed to be viewed by the driver as their own performance tool, not a management oversight mechanism.
Most fleets see measurable score improvements within 30–60 days of launching coaching programmes. Drivers who understand they're being scored often self-correct on speeding and harsh braking within the first week — before any formal coaching session occurs. Distracted driving improvements take longer (typically 45–90 days) because they require habit change rather than simple behaviour adjustment. Fleet-wide accident rate reductions are typically measurable within 6–12 months of consistent programme operation.
Yes — FleetRabbit connects to 200+ telematics providers via API, including Geotab, Samsara, Verizon Connect, Motive, and most OEM embedded telematics systems. Your existing hardware continues operating unchanged; FleetRabbit ingests the data stream and applies scoring models on top. No hardware replacement required. Setup typically takes 15–30 minutes per telematics integration.
Commercial fleet insurers in 2026 actively offer usage-based pricing tiers for fleets that provide telematics-documented driver behaviour data. The documentation package they typically request includes: per-driver scorecard history (12 months), fleet-wide behaviour trend data showing improvement, coaching session logs and completion records, and incident correlation reports. FleetRabbit generates this package automatically. Fleets demonstrating a documented downward trend in harsh events, speeding frequency, and distraction incidents are demonstrably lower-risk — and underwriters price them accordingly, typically 13–30% below fleet-average premiums.
Yes — and this is increasingly valuable given nuclear verdict trends in commercial trucking litigation. Telematics-documented driver behaviour data, combined with dashcam footage, provides GPS-verified, timestamped records of vehicle speed, braking, and driver attention at the time of an incident. This evidence is admissible and has been used successfully to defend against fraudulent claims and to establish clear fault attribution in genuine accidents. Fleets with comprehensive safety documentation consistently resolve claims faster and at lower cost than those relying on driver testimony alone.
Your Drivers Are Being Scored Right Now — By Your Insurance Company.
Every incident report, every claim, every renewal conversation is building an actuarial picture of your fleet's risk profile. The question isn't whether your drivers are being evaluated — it's whether you get to see the data first and act on it before it costs you. Start with FleetRabbit free on 3 vehicles. No contracts. No hardware to buy.







