Cost per mile is the one number that lets a fleet compare a tractor to a tractor, a lane to a lane, and this year to last. It is also easy to get wrong. Leave out the trailer payment, divide by loaded miles in one report and total miles in another, or compare a regional fleet to a national average, and the benchmark stops meaning anything. The American Transportation Research Institute put the average cost of running a truck at a record $2.336 per mile in 2025. This guide breaks that figure down, shows how region, fleet size and miles change it, and explains how to calculate and lower your own. To see your fleet’s numbers by truck, schedule a short demo with our team.
Fixed and variable: why the same truck can cost 40 or 74 cents a mile to own
Some costs move with every mile: fuel, tires, maintenance and, for most fleets, driver pay. Others arrive every month whether the truck moves or not: truck and trailer payments, insurance and permits. In ATRI’s 2025 averages those fixed costs came to about 51.8 cents per mile, at an average of 85,991 miles per truck. Spread the same annual fixed cost over fewer or more miles, and the per-mile figure changes sharply.
This is why utilisation is the first lever to check. A truck that sits at a dock for half a day, waits for a driver, or spends a week in the shop for a part keeps paying its fixed costs while adding no miles. Raising miles per truck without adding trucks lowers cost per mile across the whole fleet.
Loaded miles or total miles: the denominator changes the answer
ATRI reports cost per total mile. In the same study, empty miles were 16.5% of the total, excluding tanker fleets. Revenue, though, is earned on loaded miles. If you divide the same costs by loaded miles only, the average becomes roughly $2.80. Neither is wrong, but mixing them is: comparing your cost per loaded mile with a national cost per total mile makes your fleet look about 20% more expensive than it is.
Regional benchmarks: a Northeast mile cost about 29 cents more than a South-Central one
ATRI’s 2025 data put the Northeast as the most expensive region at $2.52 per mile and South-Central as the least expensive at $2.23. The differences come from different categories in different places: driver pay and tolls in the Northeast, fuel and equipment in the West.
Benchmark against your own region where you can. A Northeast fleet that matches the national average is doing well; a South-Central fleet at the same figure has room to improve.
Fleet size: small fleets paid far more per mile for fuel and repairs
ATRI’s 2025 figures for truckload fleets show a wide gap by fleet size. The largest fleets buy fuel at volume discounts and run more maintenance in-house: about 65–68% of fleets over 100 trucks, against 42% of fleets under five.
Small fleets can’t buy volume, but they can close part of the repair gap. Most of a large fleet’s maintenance advantage comes from planned work done before it fails, and that depends on records and schedules, not on size.
Why one cent per mile matters more than it looks
Margins in trucking are thin. ATRI’s 2025 study reported an average operating margin of 0.4% for truckload fleets, 0.6% for refrigerated fleets and a loss of 0.5% for flatbed and oversize. One cent per mile is about 0.43% of the average cost of a mile. For a truckload fleet at that average margin, saving one cent per mile on every mile roughly doubles operating profit. For a 50-truck fleet running 86,000 miles per truck, that cent is worth about $43,000 a year.
Where can one cent come from? Half a mile per gallon is worth several cents a mile at 2026 diesel prices. A few percentage points fewer empty miles cut every per-mile figure at once. And a fleet that moves repair and maintenance toward planned work can close part of the gap ATRI found between small and large fleets, which was more than ten cents a mile in 2025. None of these is a single big project, which is exactly why cost per mile, tracked monthly, is the right way to see them add up.
How to calculate your fleet’s own cost per mile
Where to lower cost per mile, category by category
Shares are of ATRI’s 2025 national average and will differ for your fleet. Start with the categories that are largest for you and that you can actually influence.
| Category | Share | What drives it | Measure to track |
|---|---|---|---|
| Driver pay | About 44% | Miles per driver day, dwell at docks, routing | Paid hours per loaded mile |
| Fuel | About 21% | MPG, idle, speed, price paid | Gallons per 100 miles; price vs market |
| Equipment payments | About 17% | Spec, replacement timing, utilisation | Fixed cost per mile by truck |
| Repair and maintenance | About 9% | PM compliance, breakdowns, parts | R&M per mile; miles between road calls |
| Insurance | About 5% | Safety record, claims history | Claims per million miles |
| Tires, tolls, permits | About 4% | Inflation, routing, retreads | Tire cost per mile |
Maintenance is a small share but a large lever, because it touches other categories. A breakdown adds repair cost, but it also cuts miles, idles a driver and can lead to an out-of-service order. Planned preventive maintenance lowers the repair line and protects the utilisation that keeps fixed cost per mile down.
What a national benchmark can’t tell you
ATRI’s figures come from carriers that share their operating data, mostly for-hire Class 8 fleets. They are the best public benchmark available, but three things limit how far they carry. Duty cycle: a regional day-cab operation, a long-haul sleeper fleet and a vocational dump fleet have very different costs, and an average blends them. Accounting: one fleet expenses its own shop technicians as maintenance, another counts them as payroll, and both are right. Ownership: a fleet that buys trucks outright and keeps them for years shows low payments and high repairs, while a lessor-heavy fleet shows the opposite.
The fix is to use the benchmark for direction and your own history for decisions. If your fuel cost per mile is above the regional average, find out why. If your repair cost per mile is rising faster than ATRI’s 8.6% increase for 2025, look at which trucks and components are behind it. The national figure tells you where to look; your own records tell you what to do.
A monthly cost-per-mile review that takes an hour
The review only works if the data is ready before the meeting. When fuel transactions, work orders and odometer readings land on each truck’s record as they happen, the monthly numbers are a report, not a project.
Cost per mile and total cost of ownership
Cost per mile is a running measure; total cost of ownership is the lifetime view of the same truck, from purchase to resale. The two meet at the replacement decision. As a truck ages, payments may fall or end, but repair costs, downtime and often fuel use rise. Track each truck’s cost per mile month by month, including the full cost of breakdowns, and compare it with newer trucks on similar work. When an older truck’s cost per mile overtakes a new one’s, including the new truck’s payments, replacement starts paying for itself. ATRI’s 2025 average truck age was 3.6 years, but the right replacement point for your fleet comes from your own cost curve, not the average.
Fuel, repairs and parts on every truck’s record, so cost per mile is built from real transactions
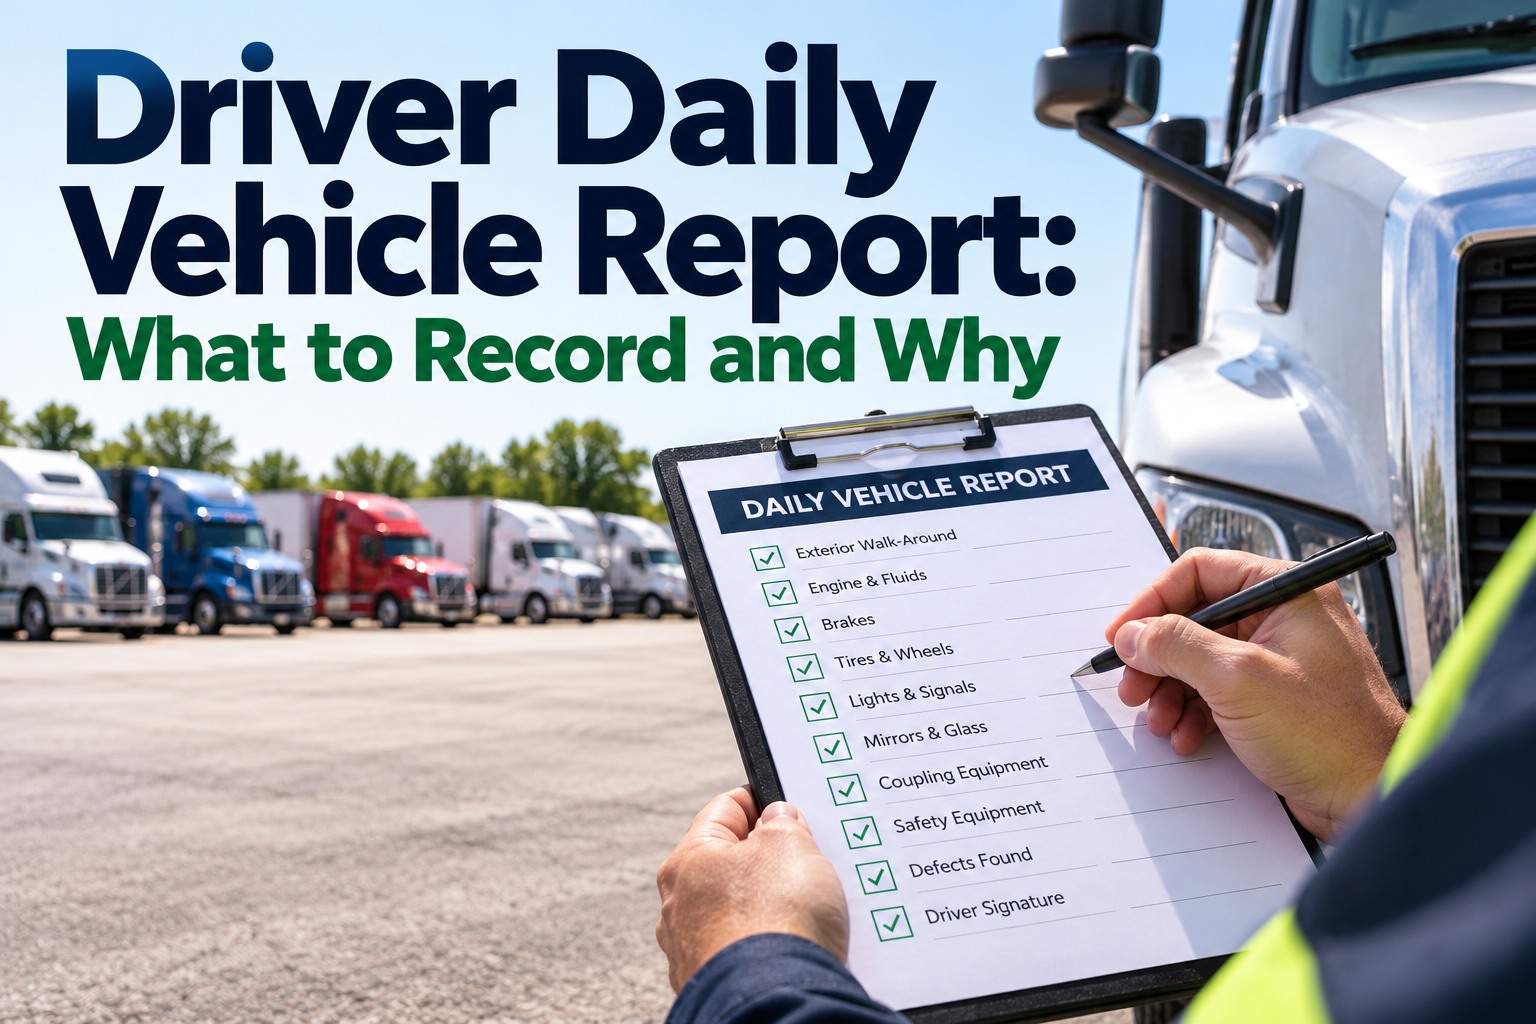
The repair line starts with the walk-around. Defects found on a digital DVIR become planned jobs, and every job, part and cost stays in fleet maintenance records, ready for the next cost-per-mile review.